| Type | Description | Contributor | Date |
|---|---|---|---|
| Post created | Pocketful Team | Aug-29-23 | |
| Add new links | Nisha | Feb-25-25 |
Read Next![]()
- Monsoon Impact on Stock Market in India Explained
- AI Advisor vs Human Advisor: Which One Should You Choose?
- What is the Nifty IT Index?
- Top 10 Richest Companies in the World
- Global ETFs in India: Best ETFs, Returns & How to Invest
- List of Best Nifty 50 ETFs in India (2026)
- Top 50 Stock Brokers in India by Active Clients
- Best IT ETFs in India (2026)
- Top 20 Stock Brokers in India for Stock Trading and Investing
- Mukesh Ambani Net Worth: Per Day, Hour & Second Income (2026)
- Top 10 Debt-Free Companies in India
- How To Apply Buyback of Shares?
- Gold vs Diamond: Which Is the Better Investment?
- Best Indian Isobutanol Stocks: Market Growth & Future Outlook
- What is Mark to Market (MTM)?
- How to Store Gold Safely in India
- Mutual Funds vs Equity: Key Differences
- Rajesh Exports SEBI Case Explained
- How to Buy and Sell Bonds in India?
- Forex vs Stock Market: Key Differences
How to find and identify undervalued stocks
Published on : 29th August 2023
|Updated on : 22nd May 2026

Undervalued stocks are stocks that are trading at a lower price than their actual fair price. At times the stock price does not fairly represent the true worth of the company. Sometimes small companies get ignored by analysts who are experiencing increased sales and better profit margins and have undervalued share prices. Investors look forward to investing in undervalued stocks because the possibilities are very high that the price of these stocks will increase in future. But, the question that arises here is how to identify these undervalued stocks.
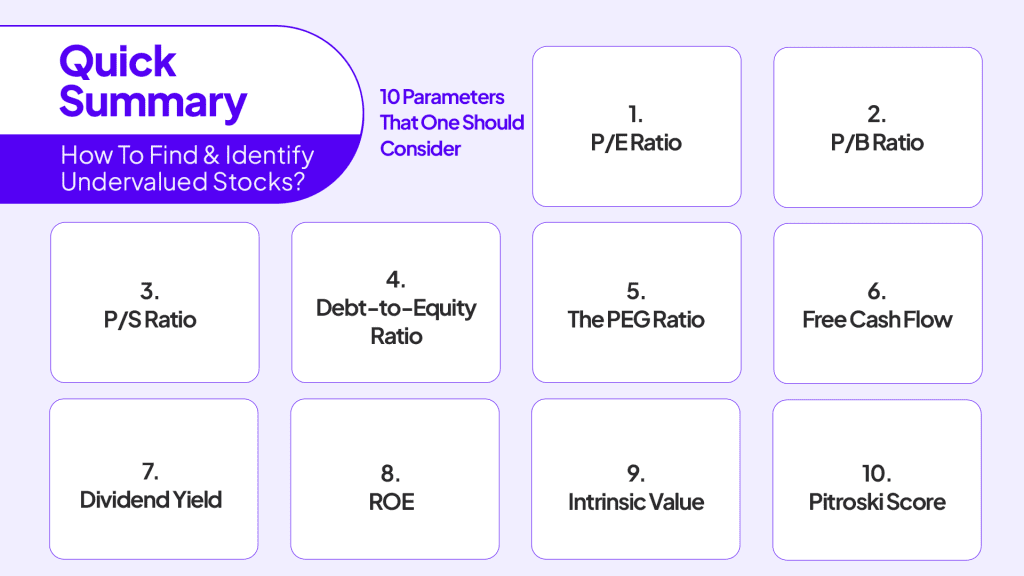
10 parameters that one should consider to decide whether the stock is fairly priced or not –
Read Also: Semiconductor Industry in India
1. P/E ratio
The P/E ratio shows the relation between the stock price and the company’s earnings. It is calculated by dividing the current market price of the stock by the earnings per share.
The ratio can be used to determine whether the stock is undervalued, overvalued or fairly valued.
- If the stock P/E is more than the industry P/E we can say that the stock is overvalued.
- If the stock P/E is less than the industry P/E we can say that the stock is undervalued.
And lastly, if the stock P/E is nearly equal to the industry P/E then the stock is fairly priced. The P/E ratio is important when determining the true worth of the company.
2. P/B ratio
The P/B ratio shows the relationship between the current stock price and its book value.
There are 3 main steps for computing the P/B ratio of any company.
- Step 1- Calculate the book value(company assets minus liabilities ) = assets – liability = book value.
- Step 2- Calculate the book value per share = book value. of outstanding shares.
- Step 3- Calculate the P/B ratio = current market of the share book value per share.
Any value below 1 is considered desirable by value investors indicating that the stock is undervalued. And a value above 3 is considered that the share is overvalued.
3. P/S Ratio
The P/S ratio or price-to-sales ratio is a financial ratio that shows the relationship between the price of the share and the sales of the company.
P/S ratio = market capitalisationnet annual sales
- An ideal P/S ratio can vary from industry to industry or sector to sector. But still, a P/S ratio between 1-2 is considered a good ratio for value investors.
- A high P/S ratio may indicate the inefficiency of the management in using the shareholder’s funds to drive more revenue.
Whereas a lower P/S ratio as compared to the industry standards may indicate that the stock is undervalued.
4. Debt-to-equity ratio
The debt-to-equity ratio is a financial ratio that is used to assess how much proportion of debt to equity a company is using to finance its assets. Debt is the creditor or debt holders’ money that is invested in the company against which they receive a payment in the form of interest regularly. Whereas equity funds are the money of the shareholders that is invested in the business.
Having a high debt-to-equity ratio can be a big red flag for any company if the free cash flow of the company is not good. Because then the company will not be able to meet its short debt financing obligations which is not good. This does not mean that having a high debt-to-equity ratio is a bad thing. It generally depends from sector to sector. A sector that requires heavy fixed assets (like automobile or construction) might have a high debt-to-equity ratio as compared to a company that does not require so many fixed assets (like the IT sector).
5. The PEG ratio
The PEG ratio is a financial ratio that shows the relationship between the price and the earnings to the growth of the company. It can be defined as an advanced version of the P/E ratio. Since the P/E ratio does not tell about the price of the stock being fairly valued taking into account only the current earnings of the company and not the forecasted future earnings.
That’s where the PEG ratio comes to the rescue it tells whether the share is being fairly valued or not at the stock exchange taking into consideration the growth rate of the company.
PEG ratio = price/EPS growth
- A PEG ratio of more than 1 is considered that the stock may be overvalued and not considered for investing by value investors.
- A PEG ratio of less than 1 indicates that the stock is undervalued than its true worth and might be a good option to invest in by value investors.
6. Free cash flow
Free cash flow is the cash left with the company after paying for its operating expenses and capital expenditures. The formula for finding the free cash flow for any company is given below.
Free cash flow cash flow from operations – (operating expenses + capital expenditure).
Having a positive FCF is a major green flag for the company because a positive FCF indicates that earnings are expected to increase in future. Which is a good sign for any value investor. Showing that either the company is experiencing sales growth or better net profit margins and that the company is effectively using their resources.
7. Dividend yield
The dividend yield is a financial ratio that shows what percentage of the share price the company is giving out as dividends to its shareholders.
Dividend yield =annual dividend paid/market price
If a company is giving out high dividends it is a green flag for any value investor and might indicate that the company is undervalued. Because generally in a company with a high dividend payout the shareholders are not only benefited from the capital appreciation but also the dividend payments give them a good annual return on their investment.
8. ROE
Return on equity is a financial ratio expressed in percentage terms indicating a relationship between the company’s net earnings and the shareholder’s equity.
ROE=(Net earnings/ shareholders equity)*100
- A 15-20% ROE is considered very good for any company as it shows how effectively the company is using the shareholder’s funds to make more money.
- An ROE higher than 20% might indicate that the management is taking a high risk on shareholders’ money to get more business.
9. Intrinsic value
Intrinsic value is the anticipated value of any stock. Based on certain parameters the IV of any stock is calculated. Taking into consideration both tangible and intangible factors.
Intrinsic value = Future cash flows(1+ discount rate)^no. of periods
It is very complicated to calculate the intrinsic value of any stock manually, and individuals can use the stock screeners available online to get the correct IV for any stock.
- If IV>current market price then the share is considered to be undervalued.
- If IV<current market price then the share is considered to be overvalued.
- If IV is almost equal to the market price then we can say that the stock is fairly valued.
10. Pitroski score
Pitroski f- score is a no. between 0-9 which is used to assess the strength of the company’s financials. It is taken into account to decide whether the stock is suitable for investing or not with 9 being the best and 0 being the worst.
The calculation of the Pitroski score is quite complicated if done by hand, there are many stock screeners available online that automatically calculate the Pitroski score for you.
- A Pitroski score below 3 is not considered good.
- A score between 3-6 is considered good.
- And a score above 6 is excellent for investing.
Conclusion
Thus we can conclude that identifying undervalued stocks is not even that hard. You just need to keep a few points in mind before starting your research.
Investing in stocks that you can hold for the long term is a good way to build a strong portfolio. Also, it is important to regularly churn your portfolio on a regular basis so that you can maximize the returns and minimise the risk in your overall portfolio.
| Selection Methodology and Important Disclaimer The stocks included in this list are selected primarily on the basis of their market capitalisation, which represents the total market value of a company’s outstanding shares. The companies are arranged in descending order of market capitalisation, with larger companies appearing first, followed by relatively smaller companies. This methodology is intended to provide a structured approach for identifying companies based on their market size and overall presence within a sector. However, market capitalisation should not be considered the sole factor while evaluating investment opportunities, as it does not guarantee future performance, profitability, or returns. Investors should also assess other important factors such as financial health, business fundamentals, management quality, valuation metrics, industry outlook, and market conditions before making investment decisions. The information provided is for educational and informational purposes only and should not be construed as investment advice, recommendation, solicitation, or an offer to buy or sell any securities by Pocketful Fintech Capital Private Limited. |
FAQs (Frequently Asked Questions)
01
What are undervalued stocks?
Stocks are trading at a lower price in the stock exchanges as compared to their actual fair price. There are various accounting financial ratios that you can use to assess the true value of the stock.
02
How to find undervalued stocks?
There are different financial ratios you can consider to decide whether the stock is undervalued, overvalued or fairly valued.
03
Fundamentally strong stocks that are undervalued in 2022 India.
You can check out any stock screener to find the top fundamentally strong stocks that are undervalued in 2022 India.
Disclaimer
The information shared in this content is intended solely for educational and informational purposes and should not be considered financial, investment, or trading advice. Any references to stocks, mutual funds, or market instruments are purely for informational purposes and do not constitute recommendations. Investments in financial markets are subject to market risks, and past performance is not indicative of future returns. Readers are advised to conduct independent research, review official documents carefully, and consult a qualified financial advisor before making any investment or trading decisions.