| Type | Description | Contributor | Date |
|---|---|---|---|
| Post created | Pocketful Team | Dec-02-24 |
Read Next![]()
- Best Stop Loss Strategies for Day Trading in 2026
- Best ETF Trading Strategies in India
- What is Overnight Trading?
- Why Option Buyers Lose Money in Trading
- Formulas used to Calculate Profit and Loss in Nifty Options
- How to Trade Fake Breakouts Using Options: 5 False Breakout Strategies
- Trade Breakouts with Options Without Overpaying IV
- How to Use MTF in the Stock Market?
- Understanding Bull Put Spread Option Strategy
- NSE Extends F&O Trading Hours by 10 Minutes
- Expiry Day Trading Explained
- High Premium Selling: Risk vs Reward Explained
- Delta Neutral Trading Strategy: What it is & How it works
- Selling Penny Options: Small Gains, Massive Risk
- Hard vs Soft Commodities: Key Differences
- How to Become a Systematic Trader: Beginner’s Guide
- 5-Minute ORB System for Option Scalping
- What is Automated Trading?
- Weekly vs Monthly Expiry in Options Trading: Key Differences
- Opening Range Breakout (ORB) Strategy
High-Wave Candlestick Chart Pattern
Published on : 2nd December 2024
|Updated on : 24th January 2025
Most candlestick patterns used by the market participants are used to predict future price movements. However, there are some patterns that can signal a consolidation phase. One such pattern is the High-Wave Candlestick pattern.
This blog will discuss the High-Wave candlestick chart pattern, its interpretation, advantages and disadvantages. We will also provide a real-world example to help you better understand the trading setup.
What is a High-Wave Candlestick Pattern?
A High-Wave is a neutral candlestick pattern, which indicates that both buyers and sellers don’t have control over the market direction. The formation of the High Wave candlestick pattern can indicate that the bearish or bullish trend has ended, which might be the beginning of a consolidation phase.
The High Wave candlestick pattern consists of a single candlestick pattern with significant upper and lower wicks. The shadows of the candlestick should be 2x or 3x compared to the body of the pattern. The candle can be bullish or bearish.
Interpretation
Whenever a high wave candlestick pattern forms on the chart, it is a signal that there is an equal amount of pressure from buyers and sellers. Both buyers and sellers try to take control, which is the reason behind long upper and lower wicks. However, neither of them succeeds, and the candle has a small body. The formation of the pattern can be interpreted as the beginning of a consolidation phase.
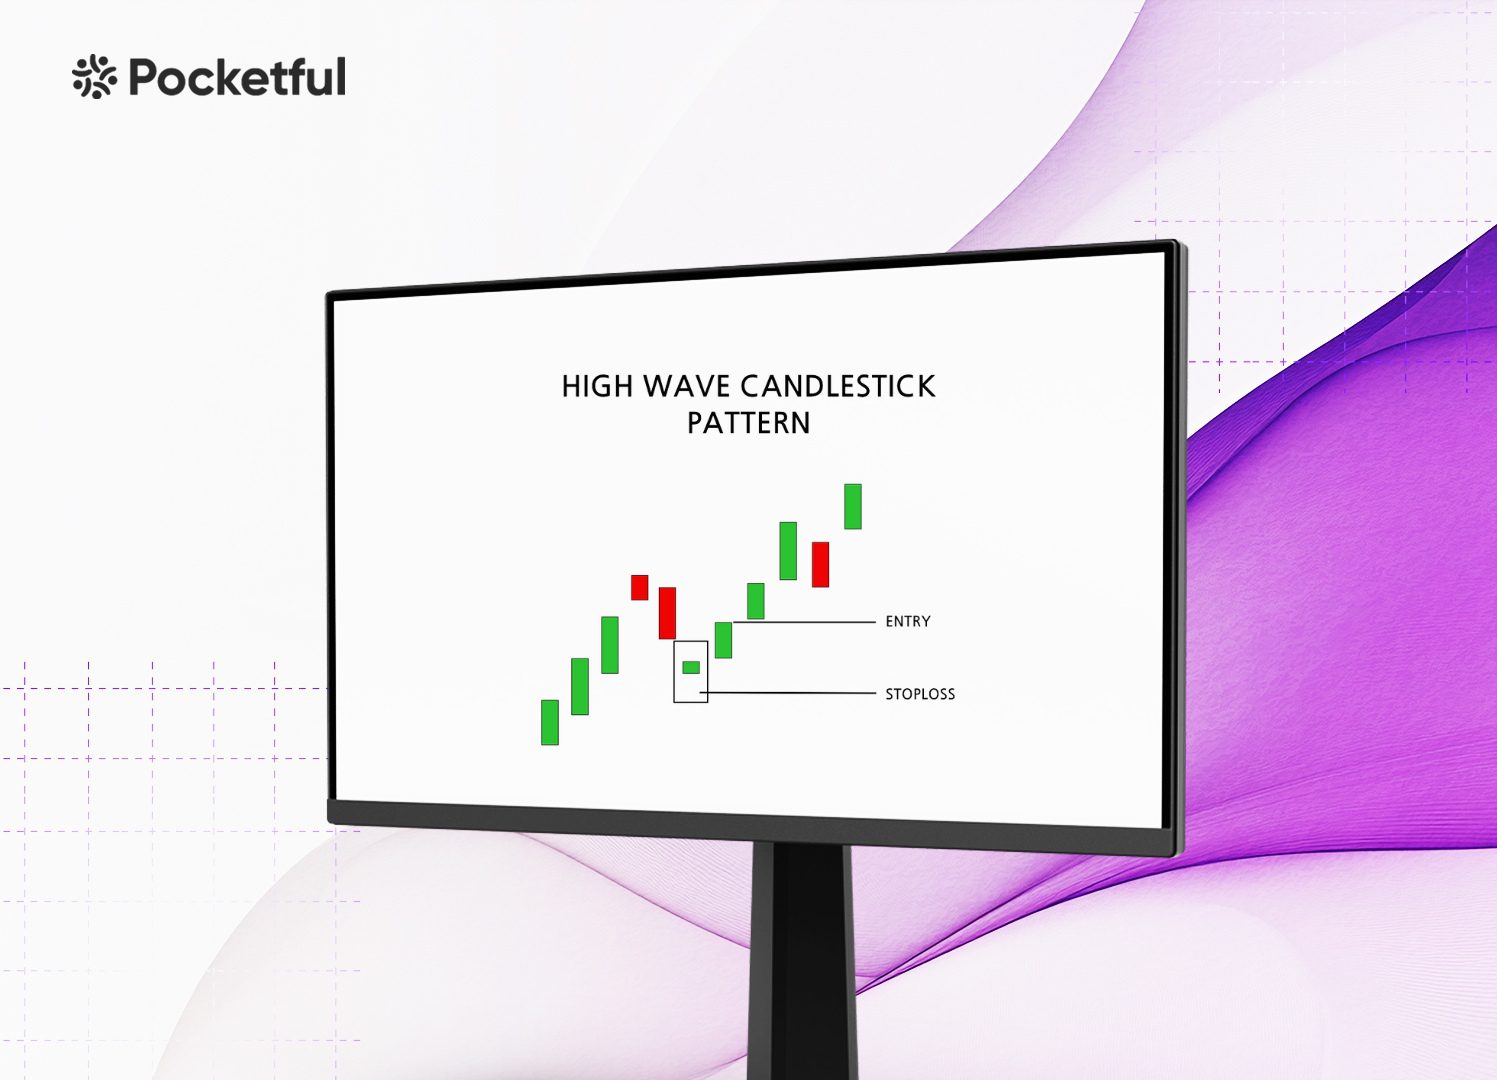
How to Determine Entry, Target & Stop-Loss?
Now that you know how to identify a High-Wave candlestick pattern in a chart and that it indicates a consolidation phase, let’s talk about how to trade using a high-wave candlestick chart pattern. In the setup below, we will be using a short strangle strategy to take advantage of the sideways markets.
- Entry: Individuals can create a short strangle, i.e. sell OTM calls and puts after the formation of the High-Wave Candlestick pattern.
- Stop-Loss: Exit the OTM call position if the price gives a breakout above the high of the pattern and exit the OTM put position if the price moves below the low of the pattern.
- Target: The maximum profit for the strategy is the combined premiums of the call and put. Individuals can wait for the premium to decrease due to sideways market conditions and realize profits according to their risk-reward ratio.
Example of High-Wave Candlestick Pattern
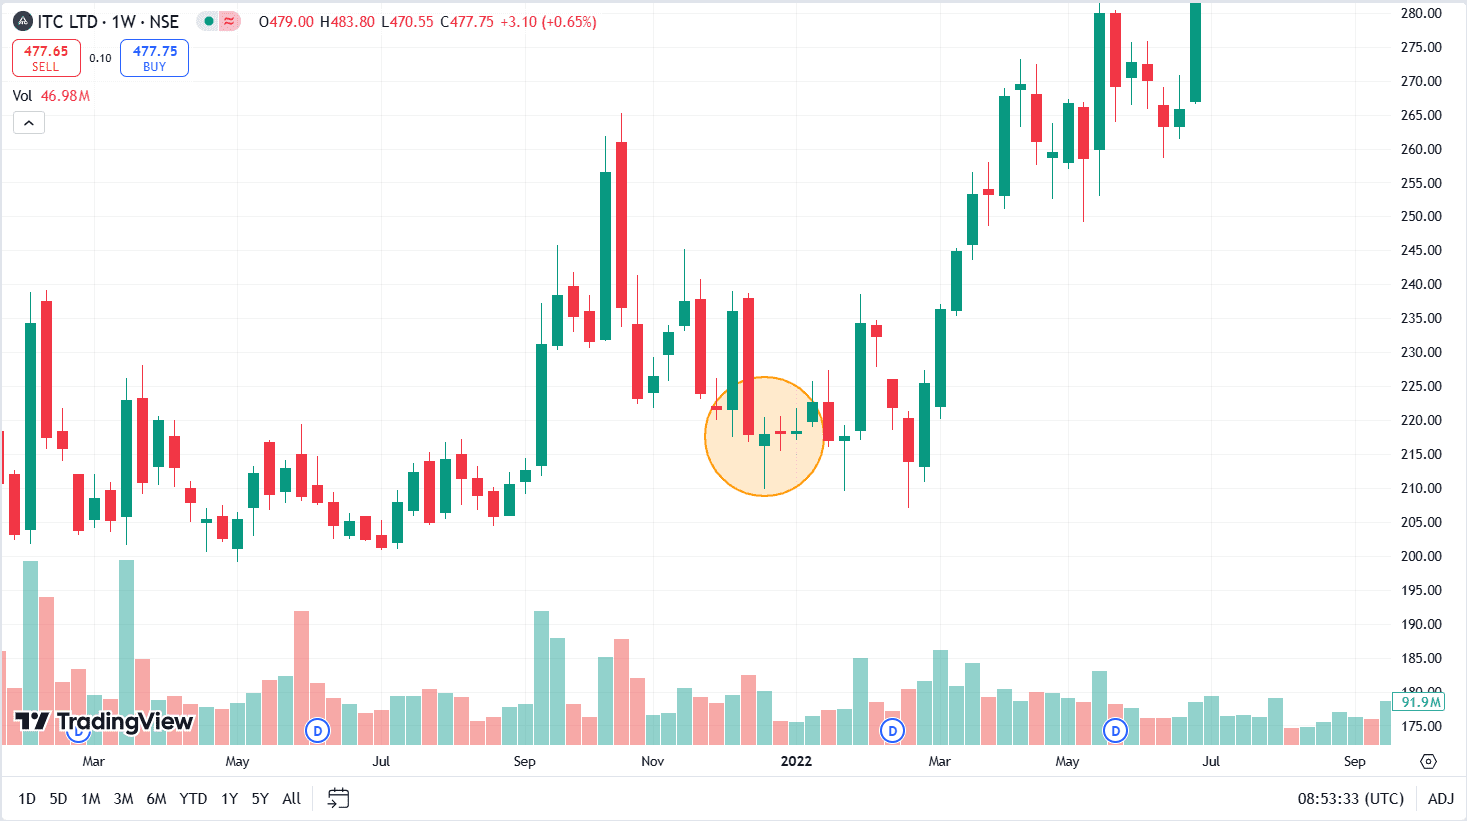
The above image shows the price chart of ITC on a weekly timeframe. The High-Wave candlestick pattern was formed on 20 December 2021, after which the share price entered a consolidation phase for two weeks. Theta decay due to sideways movement would result in profits in a short strangle strategy.
Read Also: What is a Stop Loss and How to Use While Trading?
Advantages of High-Wave Candlestick Pattern
The advantages of the High Wave Candlestick pattern are:
- Indicates Market Indecision: The High-Wave candlestick shows market indecision as the buyer and seller have no control over the market direction. This is an indicator that the prevailing trend may be about to end, and a consolidation phase might begin.
- Applicable in All Timeframes: High-Wave pattern can form in any time frame; therefore, it can be used in day trading, swing trading, etc.
- Clear Risk Management: The High-Wave candle signals indecision, which is a signal for traders to stay cautious and reconsider any long or short position regarding risk exposure.
Limitations of High-Wave Candlestick Pattern
The limitations of the High-Wave Candlestick pattern are:
- Needs Confirmation: The High-Wave pattern signal alone cannot be used on a standalone basis; rather, it requires verification from other technical indicators or a confirmation candle to provide a reliable trading signal.
- False Signals: Like any other chart pattern, the High-Wave candlestick pattern can give false signals. False signals can cause volatile price movements and result in losses in the short-strangle strategy.
- Risk due to Options: As the trading setup involves option positions, trading based on the High-Wave candlestick pattern can be highly risky. Moreover, short positions in options have limited profits and unlimited losses.
Read Also: Bullish Harami Candlestick Pattern
Conclusion
The High-Wave candlestick pattern shows indecision in the market and, in most cases, predicts a pause in the existing trend or the beginning of a consolidation phase. The pattern can be used in any time frame, but it is important to use this pattern in combination with other technical tools for better accuracy. The traders need to use options in their trading strategies to take advantage of the theta decay during the consolidation phase, which makes it risky as trading in options can result in huge losses. It is advised to consult a financial advisor before trading based on this pattern.
Frequently Asked Questions (FAQs)
01
What does a High-Wave candlestick pattern signify?
It suggests that both buyers and sellers are unable to determine a clear market trend.
02
Can I use a High-Wave candlestick pattern for intraday trading?
Yes, this pattern can be used for intraday trading in a 15-minute timeframe.
03
Is the High-Wave candlestick pattern bullish or bearish?
The High-Wave candlestick pattern can feature either a bullish or bearish candle.
04
How to trade the High-Wave candlestick pattern?
Traders can trade the High-Wave candlestick pattern by using the short strangle strategy.
05
Is volume a crucial indicator when using a High-Wave candlestick pattern?
A drop in volume with the formation of a High-Wave candlestick pattern indicates a decrease in trading activity and the beginning of the consolidation phase.
Disclaimer
The information shared in this content is intended solely for educational and informational purposes and should not be considered financial, investment, or trading advice. Any references to stocks, mutual funds, or market instruments are purely for informational purposes and do not constitute recommendations. Investments in financial markets are subject to market risks, and past performance is not indicative of future returns. Readers are advised to conduct independent research, review official documents carefully, and consult a qualified financial advisor before making any investment or trading decisions.