| Type | Description | Contributor | Date |
|---|---|---|---|
| Post created | Pocketful Team | Apr-18-24 | |
| Add new links | Nisha | Mar-18-25 |
Read Next![]()
- What Is Leverage in the Stock Market?
- Common Trading Mistakes Beginners Make (And How to Avoid Them)
- How to Pledge ETFs for Margin in India
- What Is Expiry Day Trading?
- Best ETF Platforms for Trading and Investment in India 2026
- What Is Strike Price in Options Trading?
- What is Speculative Trading?
- What is Revenge Trading?
- What Is Time Decay in Options?
- How to Read Stock Charts: A Beginner’s Guide to Chart Analysis
- What is Gold Trading?
- Top Algo Trading Programming Languages in 2026
- What is Short-Term Trading Vs Long-Term Trading Strategies?
- NSE Algo Trading Rules for Retail Traders in India
- What is a Harami Candlestick Pattern?
- What is Average Traded Price in Stock Market
- What is MIS in Share Market?
- 7 Common Mistakes in Commodity Trading New Traders Must Avoid
- Brokerage Charges in India: Explained
- What is a BTST Trade?
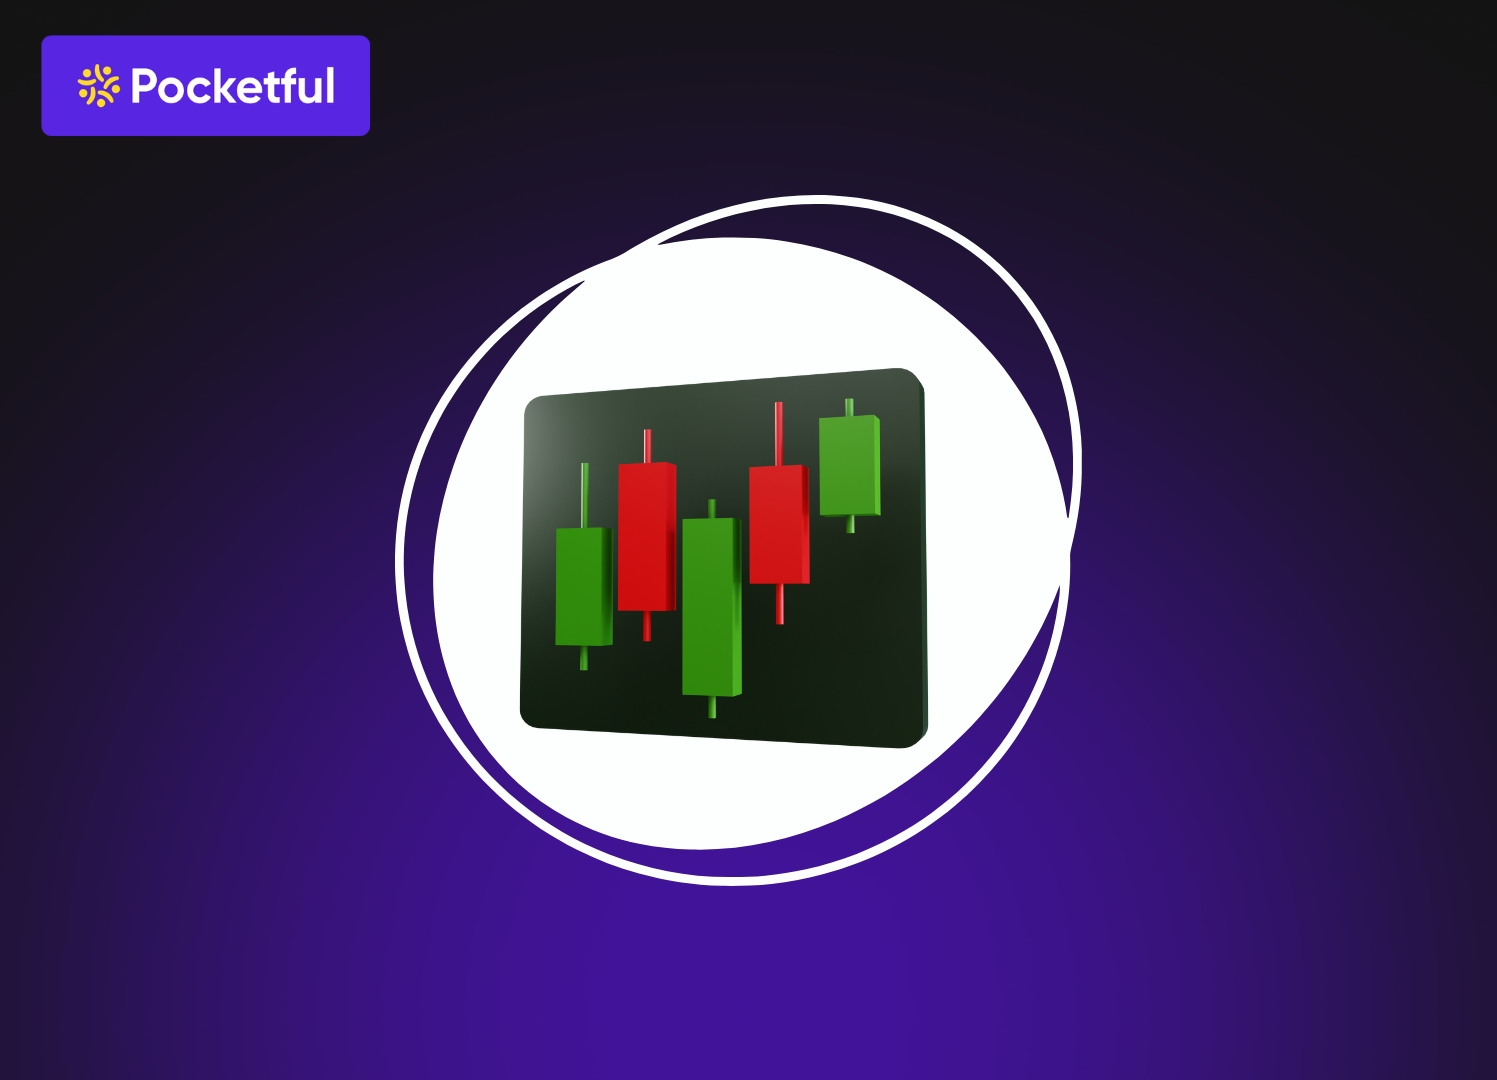
What are Candlestick Patterns? 38 Candlestick Patterns Every Trader Must Know
Written by : Pocketful Team
|Updated by : Pocketful Team
Published on : 22nd December 2025
|Updated on : 23rd December 2025
Do not be concerned if you have seen a trading chart and are wondering, “What am I supposed to do with this?” Every single trader has gone through this experience. Although the small candles on a chart may appear random and confusing initially. But once understood properly, they provide insight into what buyers/sellers are thinking about while trading. After you learn all of the candlestick patterns, you will see the markets from a different perspective altogether.
This blog includes 38 different candlestick patterns that every trader needs to know. We will try to keep it simple without complex terms or unnecessary jargon, and towards the end, you will be able to comprehend any particular candle and instantly know what the current market sentiment is: Bullish, bearish, or in a range.
Basics of Candlesticks
Let us start with an overview of what the candlestick is before going through the candlestick patterns. The candlestick consists of three main sections.
1. Candlestick Body
The body represents the overall movement of the price; therefore, it is thicker than the upper shadow and lower shadow.
- A green or white body indicates that the price moved up; therefore, buyers were dominant.
- A red (or black) body means the price ended lower and sellers had the upper hand.
2. The Wicks (or Shadows)
The thin lines above and below the body are called wicks.
- The upper wick shows how high the price went.
- The lower wick shows how low it dropped.
3. Open and Close
These two points tell the real story: open is where the candle started, and Close is where it ended. A big difference between the open and close usually means there was strong buying or selling pressure.
4. Timeframe
Every candle represents a specific period. It could be 1 minute, 15 minutes, 1 hour, or even a full day. Shorter timeframes show more sudden movements, while longer timeframes give you a clearer overall picture.
Read Also: What are Candlestick Patterns? Overview and Components
Single Candlestick Patterns
Bullish
1. Hammer – It is formed after a downtrend and signals that buyers are stepping back in. The long lower work means the market rejected lower prices, which suggests a possible bounce.
2. Inverted Hammer – This candle appears at the bottom of a downtrend with a long upper wick. It shows buyers tried to push prices up and may try a full reversal soon.
3. Dragonfly Doji – It opens and closes near the top of the candle with a long lower wick. This shows sellers pushed the price down, but buyers took over, often leading to a bullish reversal.
4. Bullish Marubozu – A strong green candle with no wicks. It shows buyers were in full control, indicating strong bullish sentiment.
5. Spinning Top – This is a small bullish candle with long wicks on both sides. It shows indecision but still gives an advantage to buyers.
6. Paper Umbrella – This candle looks similar to a hammer with a small body and a long lower wick. It shows the price was pushed down but quickly recovered, signalling possible strength.
Bearish
7. Shooting Star – This candle is formed at the top of an uptrend with a long upper wick. It shows buyers tried to push higher but failed, giving sellers the upper hand.
8. Hanging Man – It appears near the top of an uptrend and resembles a hammer and warns that the trend might be weakening as sellers are gaining power.
9. Gravestone Doji – This candle opens and closes near the low with a long upper wick, which means buyers pushed prices up but could not keep them there, often signalling a bearish reversal.
10. Bearish Marubozu – A red candle without wicks. Sellers dominated the entire session, showing strong downward pressure.
11. Spinning Top – This is a small red candle with long wicks. The market is indecisive, but sellers have a bit more control.
12. Long-legged Doji – It has long wicks on both sides, showing major indecision. Buyers and sellers were equally strong, and the next candle often decides the direction.
Double Candlestick Patterns
Bullish
13. Bullish Engulfing – This is a big green candle that completely covers the previous red candle. It is a strong sign that buyers have taken over, and a reversal may be starting.
14. Piercing – It is a bullish candle that opens lower but closes above the midpoint of the previous red candle. This shift suggests buyers are coming back with strength.
15. Tweezer Bottom – In this candlestick pattern, two candles touch the same low, showing strong support. It often marks the end of a downtrend and a potential bounce upward.
16. Bullish Harami – In this pattern, a small green candle fits inside a larger red candle. This shows selling pressure is slowing down, hinting at a reversal.
17. Bullish Harami Cross – Similar to a Harami, but the second candle is a doji. It signals that momentum is shifting to the buyers.
18. Morning Star – A three-candle bullish pattern showing selling, followed by indecision, and then a strong push upward. It’s one of the most reliable reversal signals.
Bearish
19. Bearish Engulfing – In this pattern, a big red candle engulfs the previous green candle. It shows sellers have taken control, and a downtrend may begin.
20. Dark Cloud Cover – A bearish candle opens higher but closes below the midpoint of the previous green candle. This shift shows rising selling pressure.
21. Tweezer Top – Two candles share the same high, creating strong resistance. It often signals that buyers are losing strength, and a reversal may follow.
22. Bearish Harami – A small red candle forms inside a larger green one. It hints that bullish momentum is fading.
23. Bearish Harami Cross – The second candle is a doji trapped inside the previous green candle. This increases the chances of a downward reversal.
24. Evening Star – The bearish version of the Morning Star. It starts with strong buying, moves into indecision, and ends with a strong bearish candle that signals sellers taking over.
Read Also: Chart Patterns All Traders Should Know
Triple Candlestick Patterns
Bullish
25. Three White Soldiers – Three powerful green candles that are formed back-to-back. This shows sustained buying pressure.
26. Three Inside Up – Starts with a bearish candle, followed by a small bullish one inside it, and confirmed by a strong green candle. It signals a reversal to the upside.
27. Rising Three Methods – A bullish continuation pattern: a strong green candle, followed by small corrective candles, then another push upward. It confirms the uptrend is still healthy.
28. Upside Gap Two Crows – There are three candles: a long green candlestick followed by two small red candlesticks forming a gap which is higher than the first candle’s closing price, while the second red candle was below the closing price of the first red candle
Bearish
29. Evening Star – A three-candle pattern that mirrors the Morning Star. It shows buyers slowing down, and then sellers taking full control.
30. Three Black Crows – Three consecutive strong red candles. This pattern shows consistent selling pressure and a likely shift to a downtrend.
31. Three Inside Down – Starts with a bullish candle, followed by a small red candle inside it, and confirmed by a bigger red candle. It marks a shift toward selling pressure.
32. Three Outside Down – It is created when three consecutive candlesticks, starting with a bullish candle, are followed by a bearish candle that completely engulfs the first candle, and is capped off with a closing bearish candle that closes below the previous candlestick
33. Falling Three Methods – A bearish continuation pattern. After a strong fall, a few small bullish candles appear, then another big red candle confirms the downtrend.
34. Three Line Strike – It is created by three red candles in a row, and finally, there is one long green candle, which completes the pattern. It starts below and ends above the opening of the first candle. The pattern is a short pullback and continuation of the down trend despite the fourth bullish candle.
Read Also: Three Inside Up Pattern
Additional Candlestick Patterns
35. Belt Hold – Shows a sudden and strong movement in one direction. In a bullish belt hold, price opens low and closes high; in a bearish one, it opens high and closes lower.
36. Kicker Pattern – One of the strongest reversal signals. A gap between two candles with opposite colours and no overlap in the opposite direction of the trend, showing a sudden shift in market sentiment.
37. Mat Hold Pattern – A continuation pattern where the trend pauses with small candles, then continues strongly. It shows the underlying trend is still powerful.
38. Tasuki Gap – A gap appears in the trend, and the next candle partially fills it without closing it. This confirms the trend’s strength and suggests continuation.
Conclusion
Learning candlestick pattern recognition does not assure predicting every move in the market; in fact, no market participant can predict future activities of the market. Finding candlestick patterns needs a lot of practice and will become easier with time. It is important to combine your candlestick analysis with sound risk management techniques and trend analysis when making your trades.
Frequently Asked Questions (FAQs)
01
What are candlestick patterns?
These patterns are chart formations and are created by price movements. This helps traders understand the market sentiments in a better way.
02
Do these patterns work on all timeframes?
Yes, they do, but higher timeframes are said to give more reliable signals.
03
Can I trade using only candlestick patterns?
You can do so, but it is suggested to combine them with trend analysis for better results.
04
Are long wicks good or bad?
It totally depends; long wicks usually suggest rejections or strong pushback from the opposite side.
05
How do I use candlestick charts to make trading decisions?
A candlestick chart helps you identify the momentum and direction of the stock, which can help you make your investment decision. However, along with these charts, it is essential to use different technical tools and consider the overall market condition before executing any trade.
06
Why do candlesticks have different shapes and sizes?
The size of the candle changes with the price movement of the stock.
07
What is a wick in a candlestick?
Wicks are shadows or lines that indicate where the price of a stock has fluctuated based on its opening and closing prices. A shadow represents the highest and lowest prices at which a security has been traded over time.
08
How can a beginner learn about the candlestick pattern?
A beginner’s first step is learning about the candlestick structure and identifying a few basic candlestick patterns. He can do this through books, online tutorials, educational videos, etc.
09
Who discovered the first candlestick pattern?
The candlestick pattern was first discovered by a rice trader in Japan, Homma Munesiha, in the 1700s.
010
Should beginners learn candlesticks?
Yes! They are one of the easiest and most helpful ways for understanding the market behaviour.
Disclaimer
The securities, funds, and strategies discussed in this blog are provided for informational purposes only. They do not represent endorsements or recommendations. Investors should conduct their own research and seek professional advice before making any investment decisions.
