| Type | Description | Contributor | Date |
|---|---|---|---|
| Post created | Pocketful Team | Aug-29-24 | |
| Add new links | Nisha | Mar-18-25 |
Read Next![]()
- Best Stop Loss Strategies for Day Trading in 2026
- Best ETF Trading Strategies in India
- What is Overnight Trading?
- Why Option Buyers Lose Money in Trading
- Formulas used to Calculate Profit and Loss in Nifty Options
- How to Trade Fake Breakouts Using Options: 5 False Breakout Strategies
- Trade Breakouts with Options Without Overpaying IV
- How to Use MTF in the Stock Market?
- Understanding Bull Put Spread Option Strategy
- NSE Extends F&O Trading Hours by 10 Minutes
- Expiry Day Trading Explained
- High Premium Selling: Risk vs Reward Explained
- Delta Neutral Trading Strategy: What it is & How it works
- Selling Penny Options: Small Gains, Massive Risk
- Hard vs Soft Commodities: Key Differences
- How to Become a Systematic Trader: Beginner’s Guide
- 5-Minute ORB System for Option Scalping
- What is Automated Trading?
- Weekly vs Monthly Expiry in Options Trading: Key Differences
- Opening Range Breakout (ORB) Strategy
Symmetrical Triangle Chart Pattern
Published on : 29th August 2024
|Updated on : 18th March 2025
Have you ever seen a market stuck in a range, neither rising nor falling? Indecision among market participants can result in the formation of a symmetrical triangle on a chart. This pattern is well-known for its unique shape and adaptability across different markets and time frames.
In today’s blog, we will explore the symmetrical triangle chart pattern, including key characteristics, advantages, and limitations. Understanding this pattern can provide valuable insights and improve your trading skills.
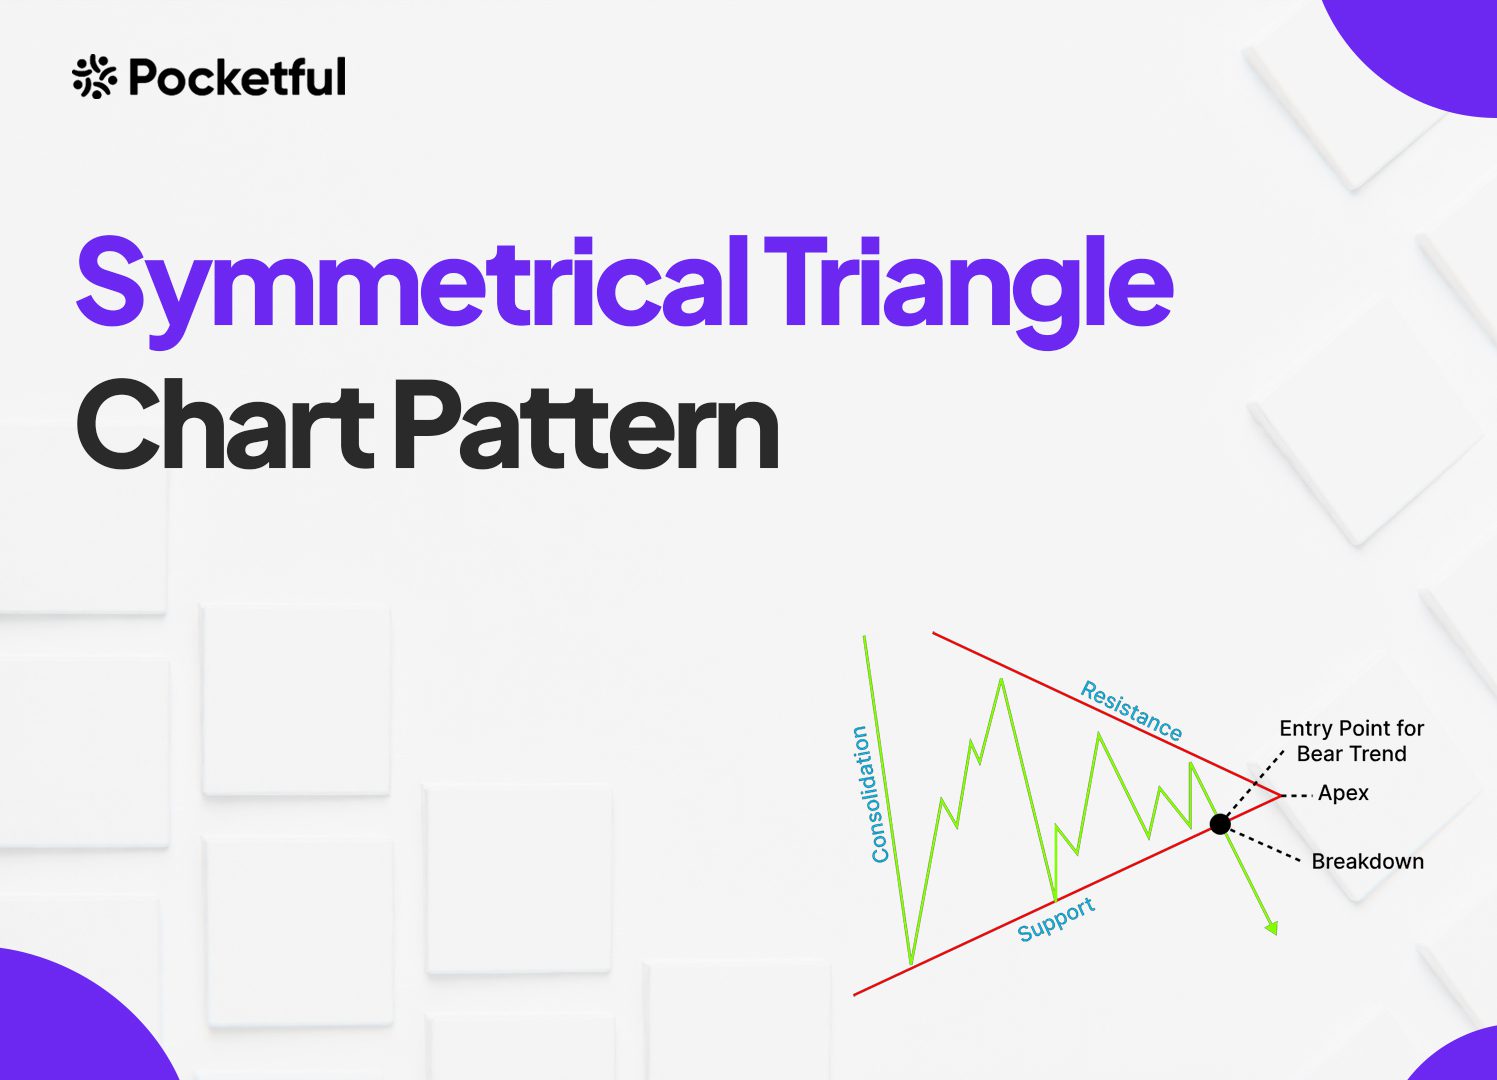
What is a Symmetrical Triangle pattern?
A symmetrical triangle pattern shows a period of consolidation in the market. It is characterized by two converging trend lines, one connecting lower highs and the other connecting higher lows, creating a triangular shape on the chart. This pattern means that the market is indecisive, where neither buyers nor sellers have an advantage.
Interpretation
When trend lines converge, price swings become smaller, indicating a decrease in volatility. The pattern typically ends with a breakout, either upwards or downwards. The breakout direction usually shows the future trend of the asset price. The pattern does not show a bullish or bearish trend. The breakout’s direction decides if the following trend is bullish or bearish.
How to Determine the Target & Stop-Loss?
A common way to predict the target for a breakout or breakdown from a symmetrical triangle is to use its height. Find the vertical difference between the top and bottom of the triangle. Adjust the height of the breakout point to get target levels by either adding or subtracting from the target.
For example, in case of a bullish breakout, if the height of the triangle is INR 10, and the price breaks out to the upside at INR 50, the possible target would be INR 50 + INR 10 = INR 60.
If the price increases, place a stop-loss just below the breakout point. A trailing stop loss can also be used to lock in profits as the price moves in your favor.
Read Also: Ascending Triangle Chart Pattern
Example
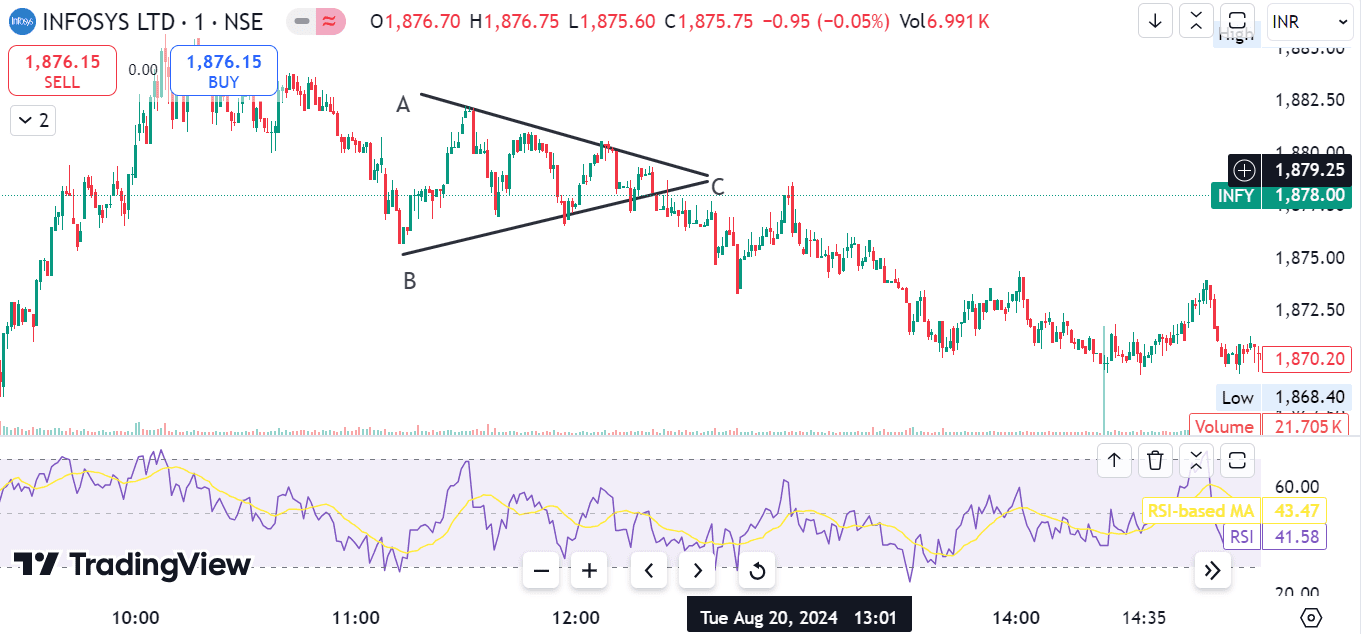
The above chart of Infosys shows a clear symmetrical triangle formation. The two converging trend lines are visible, along with a series of lower highs and higher lows. We can interpret the chart by understanding the following phases:
- Initial Formation – The pattern started with a period of price fluctuations that established the initial high and low points of the triangle.
- Market consolidation – As the trend lines converged, the market entered a phase of uncertainty characterized by decreasing price movements.
- Breakdown – The price broke below the lower trend line, confirming the pattern and suggesting that the downtrend may continue.
Advantages of Symmetrical Triangle chart pattern
The advantages of the Symmetrical Triangle chart pattern are:
- Clear Formation – The pattern is easy to recognize, so new traders can also use it.
- Reduced Volatility – The converging trend lines indicate a decrease in volatility, which can help manage risk.
- Objective – This pattern is based on price movements and does not rely on personal opinions.
- Volume Confirmation – Decreasing volume during consolidation and a volume spike during the breakout confirms the pattern and increases the chances of a successful trade.
Limitations of Symmetrical Triangle Chart Pattern
Limitations of the Symmetrical Triangle chart pattern are:
- Indecision – The pattern often indicates market indecision and can result in extended sideways trading.
- Time-Consuming – Waiting for a signal of breakout or breakdown from a symmetrical triangle chart pattern can take a lot of time.
- Lack of Direction—The pattern does not predict whether the next trend will be bullish or bearish. The direction of the breakout determines the trend.
- Late Entry – If you wait for a confirmation of the breakout, you may enter a trade later and miss out on part of the movement or enter at a less favorable price.
Read Also: Bump and Run Reversal Top Chart Pattern
Conclusion
The Symmetrical Triangle pattern is a precious tool for technical analysts, offering insight into market consolidation and potential future price movements. By comprehending its characteristics, interpretation, calculation of target, placement of stop-loss, advantages, and limitations, traders can enhance their decision-making process and make informed decisions. However, these patterns should be used in combination with other technical and fundamental analysis techniques. However, it is always advisable to consult a financial advisor.
Frequently Asked Questions (FAQs)
01
How is a Symmetrical triangle pattern formed?
It is formed by a series of lower highs and higher lows, creating a triangular shape on the chart.
02
What is the importance of converging trend lines?
Converging trend lines show decreasing volatility as the price swings become smaller.
03
Is the symmetrical triangle chart pattern reliable?
While it can be a useful tool, its reliability increases when combined with other technical indicators like volume, RSI, etc.
04
How can I manage risk when trading this pattern?
You can use a stop-loss to minimize the capital loss in case of a false breakout.
05
What time frames does the symmetrical triangle pattern work best on?
It can be used in several timeframes, from intraday charts to weekly charts, depending on the trader’s strategy.
Disclaimer
The information shared in this content is intended solely for educational and informational purposes and should not be considered financial, investment, or trading advice. Any references to stocks, mutual funds, or market instruments are purely for informational purposes and do not constitute recommendations. Investments in financial markets are subject to market risks, and past performance is not indicative of future returns. Readers are advised to conduct independent research, review official documents carefully, and consult a qualified financial advisor before making any investment or trading decisions.