| Type | Description | Contributor | Date |
|---|---|---|---|
| Post created | Pocketful Team | May-15-26 |
Read Next![]()
- Best Stop Loss Strategies for Day Trading in 2026
- Best ETF Trading Strategies in India
- What is Overnight Trading?
- Why Option Buyers Lose Money in Trading
- Formulas used to Calculate Profit and Loss in Nifty Options
- How to Trade Fake Breakouts Using Options: 5 False Breakout Strategies
- Trade Breakouts with Options Without Overpaying IV
- How to Use MTF in the Stock Market?
- Understanding Bull Put Spread Option Strategy
- NSE Extends F&O Trading Hours by 10 Minutes
- Expiry Day Trading Explained
- High Premium Selling: Risk vs Reward Explained
- Delta Neutral Trading Strategy: What it is & How it works
- Selling Penny Options: Small Gains, Massive Risk
- Hard vs Soft Commodities: Key Differences
- How to Become a Systematic Trader: Beginner’s Guide
- 5-Minute ORB System for Option Scalping
- What is Automated Trading?
- Weekly vs Monthly Expiry in Options Trading: Key Differences
- Understanding the Equity Trade Life Cycle
Opening Range Breakout (ORB) Strategy
Published on : 17th May 2026
|Updated on : 15th May 2026
To capture the early momentum, many people rely on the orb strategy. But if you are new to the market, you might be wondering, what is orb in trading? It stands for Opening Range Breakout. It is a simple but powerful method used to find early market trends.
When you use an orb in trading, you are basically waiting for the market to settle down a bit. You let the initial chaos pass and look for a clear direction. That is the core of the open range breakout strategy. By marking the highest and lowest points of the morning session, you can spot where the stock wants to go next.
In this blog, we will simplify the orb trading strategy for you. This guide will help you understand the concept clearly.
Meaning of Opening Range Breakout (ORB) Strategy
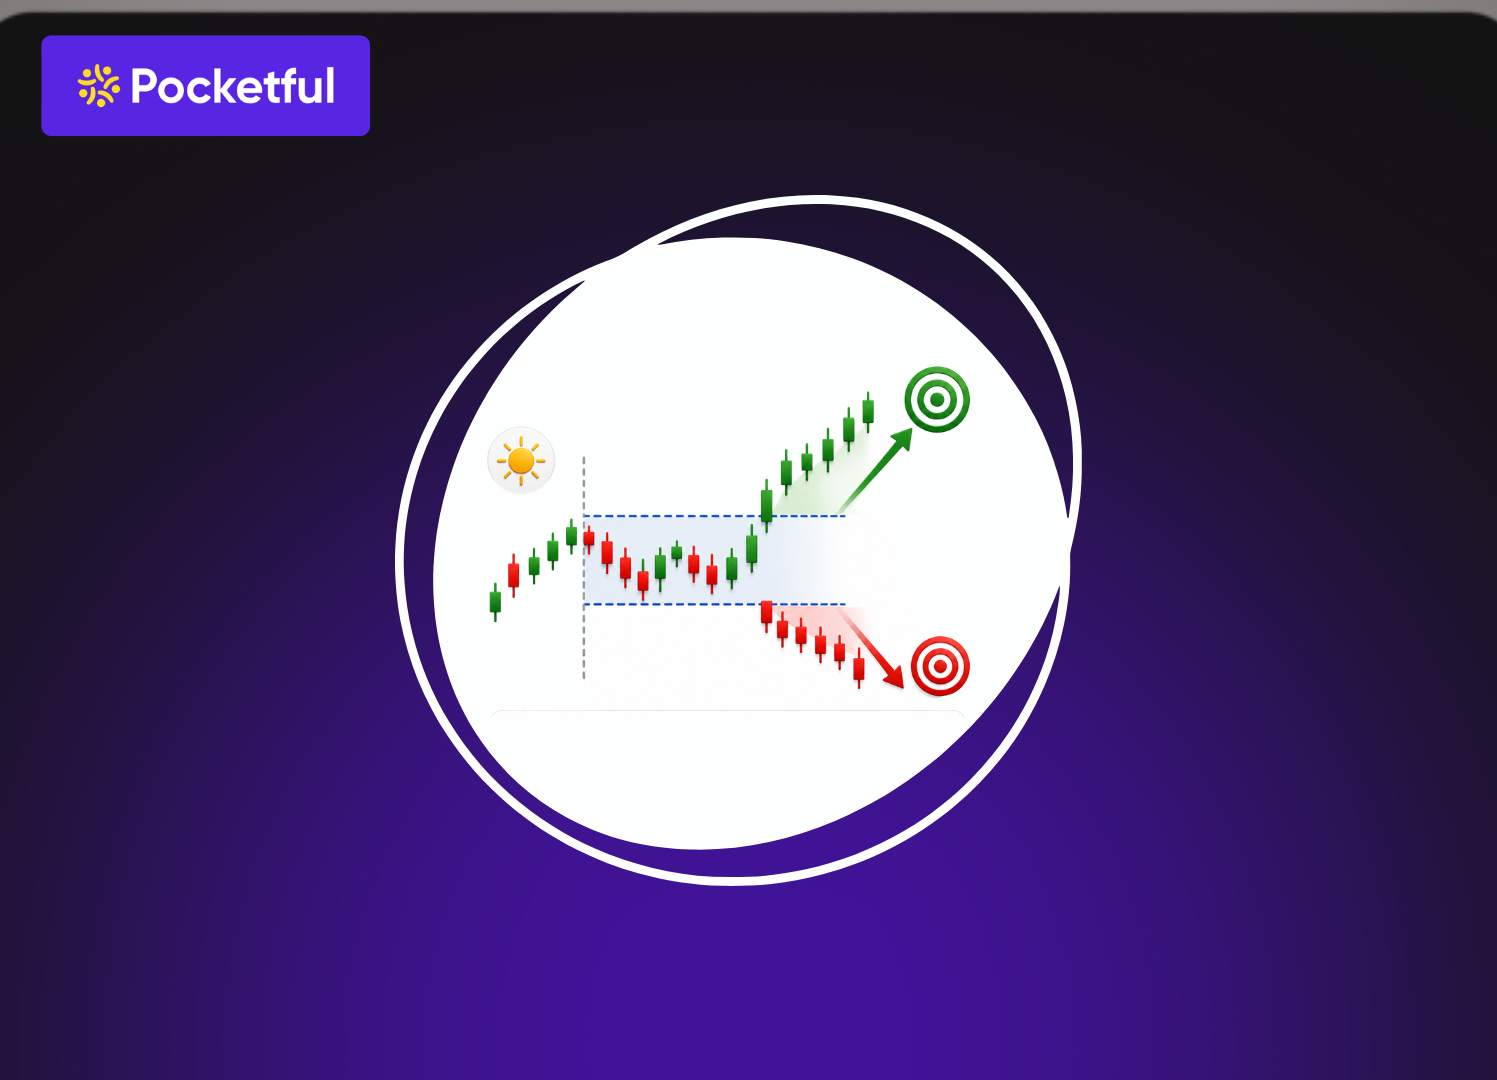
As the word describes itself, an open range breakout strategy is doing its job when buyers and sellers fight to control the stock price. At 9:15 AM in India when the market opens, this demand and supply creates a high price and a low price during a specific time, like the first 15 minutes.
The space between this high and low price is called the opening range. The strategy comes into play when the stock price breaks out of this range. If the price shoots the high limit, it is a breakout. If it goes below the low limit, it is a breakdown.
How to Identify the Opening Range Breakout Setup?
To identify the setup, you first need to pick a time frame, like the first 15 minutes of the day. You then mark the highest price and the lowest price of that period on your chart. These two lines become your support and resistance levels.
A true breakout happens when a full candle closes outside these lines. A small spike that crosses the line and comes back quickly is not a real breakout. Let us look at the two main types of setups you will encounter in the market.
For Bullish Opening Range Breakout Setup
A bullish setup tells us that buyers are in full control. You use this setup when you expect the stock price to go up. Here is how you can spot it and trade it.
- Mark the Range: Note the highest high and lowest low of the first 15 minutes.
- Wait for the Breakout: Watch the stock price closely. Wait for a 5-minute candle to close completely above the high line.
- Check the Volume: Breakouts work best when there is high trading volume. Make sure the breakout candle has higher volume than the previous candles.
- Enter the Trade: Once the candle closes above the line with good volume, you can buy the stock.
- Set Stop Loss: Place your stop loss just below the opening range low or at the midpoint of the range. This protects your money if the stock suddenly falls.
- Target: risk to reward ratio of 1:2 is a good approach in this strategy. If you are risking Rs 50 your target should be Rs 100.
For Bearish Opening Range Breakout Setup
A bearish setup tells us that sellers are taking over. You use this setup when the market is falling and you want to make money by short selling. Here is how you identify it.
- Find the Range: Just like the bullish setup, mark the high and low of the first 15 minutes.
- Watch for Breakdown: Wait for a 5-minute candle to close completely below the low line.
- Confirm with Volume: A good bearish breakout needs high selling volume. This shows that big investors are also selling.
- Take a Short Position: Once the candle closes below the low line, you can enter a short sell trade.
- Place Stop Loss: Put your stop loss just above the opening range high. This keeps you safe if the market reverses direction.
- Set Target: Again, aim for a clear target using a 1:2 risk to reward ratio.
Read Also: Best Option Selling Strategy in India
Best time frame for Opening Range Breakout Setup
Different traders prefer different time frames based on their trading style. Some like fast action, while others prefer safe and steady trades. Here is a quick comparison of the most common time frames used in the market.
| Time Frame | Best Suited For | Advantages | Disadvantages |
|---|---|---|---|
| 5 Minutes | Scalpers and quick traders | Gives very fast entry signals. Allows for smaller stop losses. | Has the highest risk of false breakouts. The market is very noisy at this time. |
| 15 Minutes | Standard intraday traders | The perfect sweet spot. Balances speed and accuracy very well. | You have to sit patiently for 15 minutes before taking any trade. |
| 30 Minutes | Swing and safe day traders | Provides highly reliable signals. Filters out morning volatility. | You might miss the first big wave of profits. Stop losses can be wider. |
| 60 Minutes | Long term position traders | Aligns with major global market trends. | Too slow for active intraday trading. Usually misses short term spikes. |
If you are just starting your trading journey, focus on the 15 minute or 30minute opening range. These time frames are less stressful and offer better win rates.
Role of opening range breakout indicator
Drawing lines manually on a stock chart every morning can be tiring. If you are watching ten different stocks, it becomes impossible to track all of them at once. This is where an opening range breakout indicator becomes your best friend.
An ORB indicator is a software tool that automatically draws the high and low lines for you. The moment the first 15 minutes are over, the indicator plots the lines on your screen. You do not have to do any math or manual tracking.
These indicators also filter out bad trades. For example, a good indicator will look at the Volume Weighted Average Price (VWAP). It will only give you a buy signal if the stock price is above the VWAP line. This adds a layer of safety to your trades.
Advantage of Opening Range Breakout
There are many reasons why professional traders love this strategy, some of them are mentioned below.
- Capture the trend: The biggest advantage is that it helps you capture early market trends. The first hour of trading often decides the direction of the entire day.
- Trading the breakout: you join the trend right at the beginning. This gives you a chance to make bigger profits compared to trading later in the afternoon. It is a proactive approach rather than a reactive one.
- High liquidity. During the morning hours, there are millions of buyers and sellers active in the market. This means you can buy and sell large quantities of shares instantly without facing any major price jumps.
- Clear exit points. You always know exactly where to place your stop loss. If the trade goes wrong, you cut your losses quickly at the range boundary. This clear rule prevents emotional mistakes and protects your trading capital.
Read Also: Options Trading Strategies
Disadvantage of opening range breakout
While the strategy is great, but here are some major challenges you can face
- False breakouts. Sometimes, the price breaks the morning high, tricking everyone into buying. Suddenly, big players sell their shares, and the price drops like a rock.
- Not reliable in the range bound market. On days when there is no major news, the market just moves sideways. The price will cross the high and low lines multiple times without forming a real trend.
- Fast decision making: The market moves very quickly in the first 30 minutes. If you are slow to enter or exit, you might miss the profit window or lose more money than planned. You have to stay highly focused and disciplined.
Conclusion
The Opening Range Breakout strategy is a fantastic tool to have in your trading arsenal. It offers a logical and rule based way to trade the morning market momentum.
Always keep in mind no strategy has 100 percent winning chances. Main focus area in ORB is strong risk management and patience. Always use stop losses, wait for volume confirmation, and do not get frustrated by a few false breakouts.
Platforms like Pocketful made trading very easy for beginners as well as experts with help of their tools. keep your rules simple, and you will slowly see consistency in your trading journey.
Frequently Asked Questions (FAQs)
01
What does ORB stand for?
ORB means Opening Range Breakout, it is an intraday trading strategy. It involves marking the highest and lowest prices of a stock during the first few minutes of the market open.
02
What are the main benefits of using the ORB strategy?
The biggest benefit is that it helps you identify the market trend very early in the day. It also provides clear entry and exit points.
03
How to use the ORB strategy effectively?
Mark the high and low on your chart. When a 5-minute candle closes outside this range with high volume, you enter the trade. Always place a stop loss at the opposite end or the middle of the range to protect your money.
04
Can a beginner trade in ORB strategy?
For beginners, the 15-minute or 30-minute time frames are the best. These time frames filter out the extreme volatility of the first few minutes.
05
Can I use ORB strategy for Long term holdings?
No, the ORB strategy is not built for the long term holding of the shares.
Disclaimer
The information shared in this content is intended solely for educational and informational purposes and should not be considered financial, investment, or trading advice. Any references to stocks, mutual funds, or market instruments are purely for informational purposes and do not constitute recommendations. Investments in financial markets are subject to market risks, and past performance is not indicative of future returns. Readers are advised to conduct independent research, review official documents carefully, and consult a qualified financial advisor before making any investment or trading decisions.