| Type | Description | Contributor | Date |
|---|---|---|---|
| Post created | Pocketful Team | Jun-11-26 |
Read Next![]()
- What is Tender Period in MCX?
- Top 10 Biggest Stock Market Crashes in India
- What is Reversal Trading?
- What Is an OCO Order?
- Bankex vs Sensex: Key Differences
- How to Earn Money in Share Market?
- Difference Between Sensex and Nifty
- What Is a Brokerage Account?
- Best Stop Loss Strategies for Day Trading in 2026
- Best ETF Trading Strategies in India
- What is Overnight Trading?
- Why Option Buyers Lose Money in Trading
- Formulas used to Calculate Profit and Loss in Nifty Options
- Trade Breakouts with Options Without Overpaying IV
- How to Use MTF in the Stock Market?
- Understanding Bull Put Spread Option Strategy
- NSE Extends F&O Trading Hours by 10 Minutes
- Expiry Day Trading Explained
- High Premium Selling: Risk vs Reward Explained
- Delta Neutral Trading Strategy: What it is & How it works
How to Trade Fake Breakouts Using Options: 5 False Breakout Strategies
Published on : 11th June 2026
|Updated on : 11th June 2026
Have you ever bought a stock right when it crossed a resistance, expecting a huge rally, only to watch it crash seconds later? You are not alone. This is a classic market trap known as a false breakout. Big institutions use this trick to hunt the stop losses of retail traders and grab liquidity. If you do not know how to spot this trap, your trading account will suffer a slow death by a thousand cuts.
But what if you could flip the script and profit from these fakeouts? By using options, you can strictly limit your risk and capture fast market reversals. In this blog, we will explore five simple strategies to trade fake breakouts.
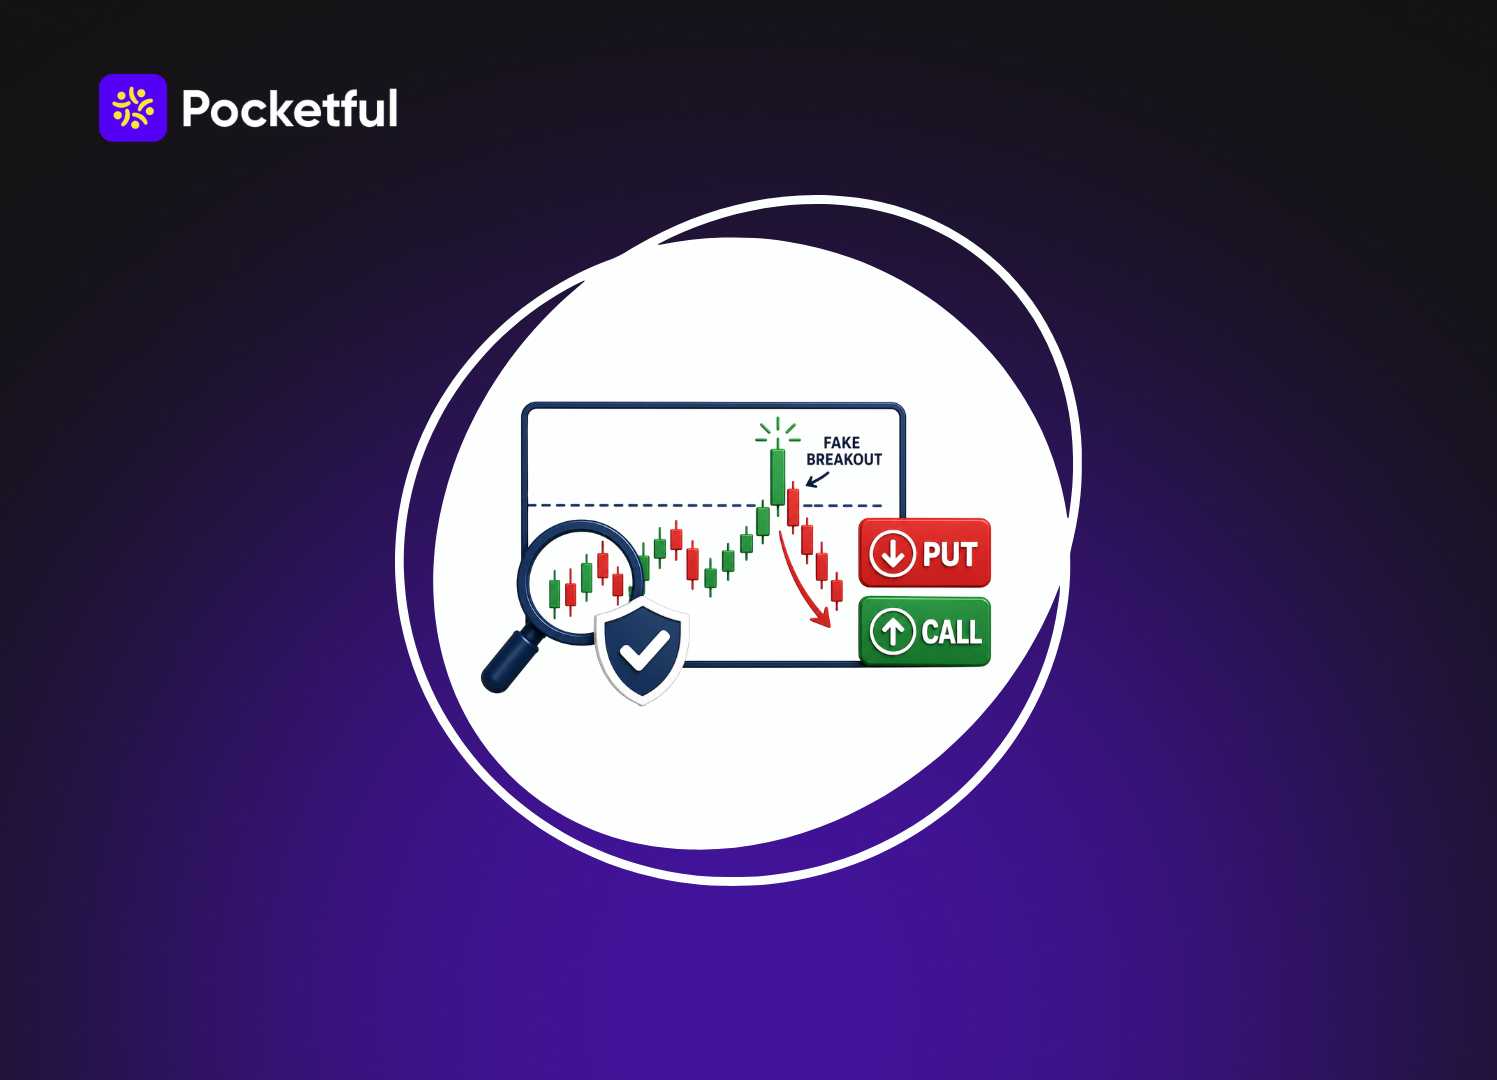
What is a Fake Breakout?
A false breakout basically looks like a real breakout at first glance. The stock price pushes past a known support or resistance level. However, the momentum quickly dies, and the price reverses.
Imagine Nifty is facing strong resistance at the 20,000 level. Suddenly, the index rallies and crosses 20,050. Many traders will assume this is a bullish breakout and buy Call options. But, if the volume is very low, it is a clear warning sign. Within a few minutes or hours, Nifty might slip back below 20,000, leaving all the buyers trapped.
Here is a simple table to help you spot the difference between a real move and a fake move.
| Feature | True Breakout | Fake Breakout (Fakeout) |
|---|---|---|
| Volume Level | Very high trading volume | Low or average volume |
| Price Follow-Through | Price continues in the breakout direction | Price reverses very quickly |
| Candlestick Shape | Strong close beyond the resistance level | Quick rejection with a long wick |
| Momentum Indicators | RSI and MACD move up strongly | Indicators show weakness or divergence |
In the options market, you can use Open Interest (OI) to confirm the trap. If Nifty breaks 20,000, but the big option sellers do not close their Call options at 20,000, it means they are not scared. They know the breakout is fake. You can use this data to take a reverse trade and profit from the fall.
Why Fake Breakouts Happen
Fake breakouts are not just random market accidents. They usually happen for a few specific reasons. First, there is stop loss hunting. Big institutions and operators know exactly where retail traders place their stop loss orders. They push the price just past a major resistance level to trigger these orders, grab the available liquidity, and then quickly reverse the direction.
Another major reason is low trading volume. If a stock breaks out but only a few people are buying, the move lacks real strength and will likely collapse. Sometimes, sudden news events cause a quick price spike that fades as soon as the excitement dies down. Finally, when too many traders expect an obvious breakout and rush into overcrowded trades, the setup becomes weak and easily turns into a trap
5 False Breakout Strategies
Trading against the crowd can be very profitable if you use the right methods. Here are five simple and effective strategies to trade fake breakouts using options.
1. Momentum Reversal Strategy
This strategy focuses on spotting failed breakouts that have very weak price follow-through. You look for a stock that breaks a level but immediately forms a reversal candlestick, like a shooting star.
When you see this rejection on low volume, you can prepare for a downward move. As an option buyer, you can buy an At-The-Money (ATM) Put option right after the low of that rejection candle is broken. This captures the fast downward momentum as trapped buyers sell their positions in panic. Keep a strict stop loss just above the highest point of the fake breakout candle to protect your capital.
2. Trading the Macro Trend
False breakouts are very common when a stock tries to move against its main trend. For example, if a stock is in a long-term downtrend, it makes lower lows and lower highs. Sometimes, it will give a fake upside breakout to trap greedy buyers.
Instead of buying Put options, you can use a safer strategy called a Bear Call Spread. In this strategy, you sell a Call option near the resistance and buy another Call option at a higher price. This gives you an upfront premium credit. You will make money as long as the stock price stays below your sold Call option, even if the market goes sideways.
3. Surviving News Event Traps
Big news events like earnings reports or government policies create wild swings in the market. During these times, prices often spike above resistance levels, only to crash back down a few minutes later. These are news-driven fakeouts.
The best strategy here is to avoid trading right when the news comes out. Wait for the initial spike to cool down. If the price falls back into its old range, you can sell Out-Of-The-Money (OTM) options. Since the news event is over, the options premium will drop quickly due to falling volatility, giving you a nice profit.
4. Multi-Timeframe Alignment
A breakout on a 5 minute chart might look amazing. However, it could just be a minor blip on the 1 hour chart. To avoid traps, you must check multiple timeframes.
If the 5 minute chart shows a breakout, but the 1 hour chart shows the price is hitting a major resistance, it is likely a fakeout. You can use the advanced Option Chain during these moments. If you see heavy Call writing at that resistance level, you can safely enter a short trade using a Put Debit Spread, knowing the bigger timeframe is on your side.
5. Tracking the Put-Call Ratio (PCR)
The Put-Call Ratio helps you measure the mood of the market. A high PCR means the market is bullish, while a low PCR means the market is bearish. You can use this to spot a fake breakout.
If the Nifty index breaks out to a new high, but the PCR drops or does not increase, it is a huge warning sign. It means option sellers are not supporting the rally. When you see this mismatch, you can anticipate a fakeout. You can then execute your preferred options strategy, knowing the data is telling a different story than the price chart.
Limitations of Trading Fake Breakout Using Options
Every strategy has its own disadvantages. Here are some limitations of fake breakout strategies:
- The Enemy Called Time Decay: If you are buying options, time is your biggest enemy. If a fake breakout happens, but the price falls very slowly, the value of your purchased option will drop every single day.
- Sudden Volatility Spikes: If you are selling options or credit spreads, a sudden massive move can hurt you. If the trap was actually a genuine move by huge institutions, the price might blast through your safety levels.
- Execution Speed: Fake breakouts happen very fast. By the time you notice the trap, the price might have already reversed heavily.
Read Also: Breakout Trading: Definition, Pros, And Cons
Conclusion
At the end of the day, trading is mostly about patience. Fake breakouts are literally built to trap the impatient crowd, but once you know the telltale signs – low volume, long wicks, and misaligned options data – those traps actually become some of your best setups.
Options give you a serious edge here. Whether you’re buying puts for a quick reversal or selling credit spreads to play it a bit safer, you have the flexibility to manage risk on your own terms. Just keep your stops tight and protect your capital. If you want to practice these setups in real-time, check out Pocketful. It has free advanced charts and detailed option chains that make reading the data a lot easier. understanding the IPO bidding process is essential before making any IPO application and increasing the chances of successful allotment.
Frequently Asked Questions (FAQs)
01
What does fake breakout in trading mean?
A fake breakout happens when a stock price crosses a major support or resistance level but fails to continue in that direction.
02
What are the benefits of using options for fake breakouts?
The biggest benefit is risk management. By buying options, your risk is strictly capped to the premium paid, protecting you from sudden market shocks.
03
How do I use Open Interest (OI) to spot a false breakout?
You can look at the Option Chain when a stock breaks a resistance level. If the Open Interest for Call options at that level does not drop, it means big option sellers are confident the price will not stay up.
04
How can the Put-Call Ratio (PCR) help me avoid traps?
The PCR measures market sentiment. If the market is breaking to a new high, but the PCR is dropping or staying flat, it means the broader market is not supporting the bullish move.
05
Should I buy options or sell credit spreads during a fakeout?
If you expect a very fast and aggressive reversal, buying an At-The-Money option can give you quick profits. However, selling a credit spread is a better choice because you will benefit from time decay.
Disclaimer
The information shared in this content is intended solely for educational and informational purposes and should not be considered financial, investment, or trading advice. Any references to stocks, mutual funds, or market instruments are purely for informational purposes and do not constitute recommendations. Investments in financial markets are subject to market risks, and past performance is not indicative of future returns. Readers are advised to conduct independent research, review official documents carefully, and consult a qualified financial advisor before making any investment or trading decisions.