



| Type | Description | Contributor | Date |
|---|---|---|---|
 | Post created | Pocketful Team | Jul-03-26 |
Read Next
- What is Commodity Swap?
- Compounding Strategy in Commodity Trading
- How to Invest Long Term in Commodities
- Hard vs Soft Commodities: Key Differences
- What is Indian Commodity Exchange (ICEX)?
- Top 10 Precious Metals to Invest in India
- Gold Import Duty Hike in India – Reasons & Impact
- Silver Hallmark India Purity: How to Check, Meaning & Investment Guide (2026)
- How to Buy Silver Coins & Bars in India
- Silver Price Last 10 Years in India
- Gold to Silver Ratio in India: Meaning, Formula & Investment Strategy (2026)
- Is Silver a Good Investment in 2026? Benefits & Risks
- What is Kasu Gold?
- Which City Has the Highest Gold Price in India?
- Which City Has the Lowest Gold Price in India?
- AI in Commodity Trading: Benefits, Risks & Future Trends
- MCX vs NCDEX: Key Differences
- MCX Copper Trading Guide 2026: Price Factors & Strategies
- What is Commodity Margin?
- How to Hedge with Commodity Trading: A Practical Guide
Commodity Channel Index – CCI Meaning, Formula & Strategy
Published on : 3rd July 2026
|Updated on : 22nd September 2026



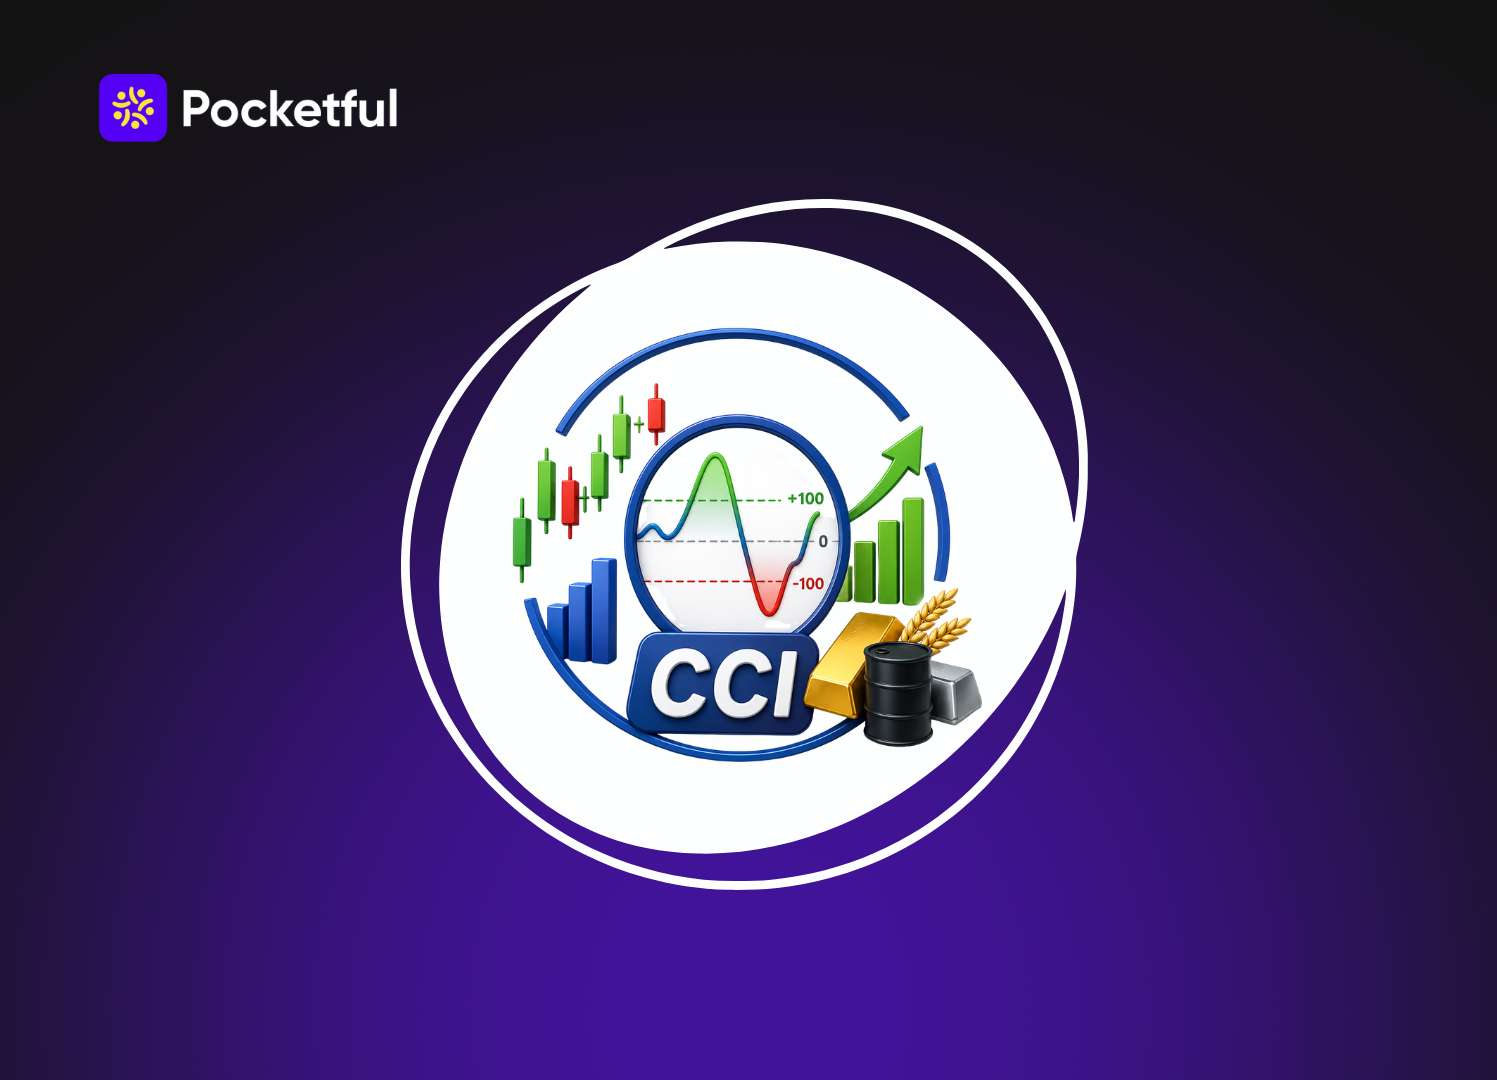
If you have been trading on NSE or BSE for a while, you have probably come across a dozen indicators that suggest “when to buy” and “when to sell.” Most of them disappoint at some point. But the Commodity Channel Index has held its ground for over four decades. And honestly, once you understand what it is actually doing, trading becomes easy.
Let us break it down properly: the concept, the formula, a real example, and how to use it in Indian markets.
What is Commodity Channel Index (CCI) Indicator?
- The Commodity Channel Index is an oscillator indicator used to identify price reversals, price extremes, and trend strength in technical analysis. It measures an asset’s current price in relation to its average price over a predetermined period of time.
- It was introduced by Donald Lambert back in 1980. Lambert originally built it for commodity futures, but the market quickly figured out it works just as well on stocks, indices, and currencies.
- The name has “commodity” in it, which confuses people. The word commodity in the indicator’s name might seem to suggest it applies only to things like oil or gold, but it can be used for analyzing and making decisions about any asset.
- At its core, CCI answers one simple question: Is the current price unusually high or unusually low compared to recent history?
- When the CCI is above zero, it indicates that an asset’s price is higher than the historic average, and vice versa.
Let us understand CCI with a simple analogy
Suppose the average price of a stock over the last 20 years is a steady line.
When a stock behaves normally, its price hovers close to this average.
If big news hits and people start buying, the price is stretched far above the average, similar to that of a rubber band.
The CCI measures how tightly that rubber band is stretched.
If it is stretched too far, it indicates that the price will be pulled back towards the average.
Interpretation of the Commodity Channel Index (CCI) Indicator
| Level | Interpretation |
|---|---|
| The +100 and -100 Levels | These are the most watched levels. When the CCI moves above +100, a new strong uptrend is beginning, signalling a buy. When the CCI moves below −100, a new, strong downtrend is beginning, signaling a sell. |
| The +200 and −200 Levels | Readings above +200 or below −200 indicate very strong trends. In the Indian market context, you will sometimes see this on high-momentum days like post-RBI policy announcements, budget day, or when FII/DII activity is unusually heavy on one side. |
| The Zero Line | Traders use the zero-line crossover as a simpler entry sign. A long position opens when the CCI indicator line crosses its zero level upwards. A short position opens when the CCI indicator line crosses its zero level downwards. This works better on longer timeframes like daily or weekly charts |
Decoding CCI Formula
CCI = (TP – SMA) / (0.015 * MD)
Where,
TP = Typical Price
SMA = Simple Moving Average
MD = Mean Deviation
How to Calculate Commodity Channel Index?
Step 1: Find the Typical Price
Instead of just using the closing price, CCI considers the average of the high, the low, and the close of the candle.
Typical Price = (High + Low + Close ) / 3
Why does CCI consider the average price? Because the close price alone can be misleading.
Step 2: Find the SMA
Now take the typical price over the last 20 days or the period that you have set and average it. This will become your baseline.
This can also be considered as the SMA of the typical price.
Step 3: The Difference
Subtract the average from the typical price.
Step 4: Find Mean Deviation
You need to understand that not every stock behaves in the same way. Some stocks swing ₹50 a day while others barely move ₹5.
CCI calculates the average distance of the price from the 20-day moving average. This is called mean deviation.
Step 5: Constant Value
The 0.015 is a scaling factor which was set by Lambert.
Example
Let us take a simple example;
Suppose you are tracking ABC stock on a 20-day daily chart
Today’s candle prices are as follows;
- High: ₹1,290
- Low: ₹1,270
- Close = ₹1,285
First, find the typical price
TP = (₹1,290 + ₹1,270 + ₹1,285) / 3
= ₹1,281.7
Then, find the 20-day average
Assume that the 20-day average (SMA) of the typical price works out to be ₹1,250. This shows that the stock has been trading around this price recently.
Now find the difference
Typical Price – SMA = ₹1,281.7 – ₹1,250
= ₹31.67
Therefore, we can say that today’s price is ₹31.57 above its actual price.
After this, you need to check how much the stock usually moves
After running the calculation, consider that the MD is ₹15
This implies the stock swings around ₹15 above or below its average on a given day.
Hence, CCI = 31.67 / (0.0015 * 15)
= 141
Interpretation of 141
If we interpret this, it means that the price of the ABC stock has moved above its normal range, which signals that strong buying momentum has suddenly kicked in, and if it continues, it could be the possible beginning of an uptrend.
Read Also: What is Commodity Market in India?
Applications of CCI Divergence in Technical Analysis
1. Spotting New Trends Early
For swing traders tracking mid-cap stocks on NSE, this is particularly useful. When a stock breaks above +100 on the CCI after consolidating for weeks, it often marks the beginning of a sustained move. The CCI gives you that early heads-up before the broader market catches on.
2. Identifying Overbought & Oversold Zones
A security would be considered oversold when the CCI dips below -100 and overbought when it exceeds +100. From oversold levels, a buy signal might be given when the CCI moves back above -100. From overbought levels, a sell signal might be given when the CCI moves back below +100.
Say you are tracking a stock on a daily chart and the CCI drops to -140. That means the stock is trading below its recent average and it may be oversold. You watch for CCI to start recovering back above -100 as a buy sign, combined with support on the price chart.
3. Divergence
Divergences occur when a stock’s price and the indicator are moving in opposite directions.
Divergences occur when a stock’s price and the indicator are moving in opposite directions. A bullish divergence can be identified when a stock’s price is making lower lows, but the CCI indicator is making higher lows. Conversely, bearish divergence occurs when price is making higher highs, but the CCI indicator is making lower highs.
Conclusion
No indicator is a magic signal to buy or sell. But if used correctly, it gives you a clear, objective way to measure where price is hovering relative to its recent history, which is genuinely useful information.
Whether you are a swing trader tracking large caps on NSE, or a commodity trader tracking MCX crude, CCI gives you a consistent framework to spot extremes and possible turning points. Pair it with price action and one or two other indicators, and it becomes a good addition part oto your technical analysis indicators list
However, watch how it behaves over a few weeks, and gradually build your own understanding of what CCI levels mean for the specific instruments you trade.
Frequently Asked Questions (FAQs)
01
Do we use CCI only for commodities like gold and crude oil?
No. CCI works equally well on stocks, indices like Nifty and Bank Nifty, currencies, etc.
02
Can CCI go beyond +100 or -100?
Yes. It is unbound oscillator with no fixed limits.
03
Should we use CCI alone for trading decisions?
No, it works best when combined with other indicators like moving averages, RSI, or price action analysis.
04
Is CCI suitable for intraday trading?
Yes, many futures and options traders use CCI on 5-minute or 15-minute charts for Bank Nifty and Nifty.
05
Where can I find CCI?
You can find CCI on charting platforms like TradingView or Chartink
Disclaimer

The information shared in this content is intended solely for educational and informational purposes and should not be considered financial, investment, or trading advice. Any references to stocks, mutual funds, or market instruments are purely for informational purposes and do not constitute recommendations. Investments in financial markets are subject to market risks, and past performance is not indicative of future returns. Readers are advised to conduct independent research, review official documents carefully, and consult a qualified financial advisor before making any investment or trading decisions.
Article History