



| Type | Description | Contributor | Date |
|---|---|---|---|
 | Post created | Pocketful Team | Aug-14-26 |
Read Next
- Delta in Options: Meaning, Formula, Uses & Examples
- What is Commodity Pool Operator (CPO)?
- Best Penny Stock Trading Platforms, Brokers & Apps
- Bid Price and Ask Price: Key Differences
- What is After Hours Trading: Definition, Benefits & Risks
- Minimum Capital Required for Options Trading in India
- Trading Terminal: Meaning, Features, Types & Benefits
- MTF Charges vs Normal Trading Charges: Key Differences
- Slippage in Trading: Meaning, Types, Causes & How to Reduce It
- Types of Stock Market Orders Explained
- What Is Cash Trading? Meaning, How It Works & Benefits
- What is Max Pain Theory?
- What is Averaging Up in Stock Trading?
- What Is an After Market Order (AMO)? Meaning, Timing & How It Works
- How to Reduce Risk in Options Trading: 10 Tips
- What is Speculative Trading in Stock Market?
- What is Pair Trading?
- What is Quoted Price in Commodity Trading?
- Best Strategies to Trade from Charts
- Kelly Criterion for Stock Trading
How To Use Directional Movement Index In Trading?
Published on : 15th August 2026
|Updated on : 14th August 2026



While it may seem easy to place a trade based on a sharp rise or fall in a stock within the Indian market, the real challenge lies in identifying the correct trend. The Directional Movement Index (DMI) can help improve this understanding. In this blog, we will explore how to interpret and use it in trading.
What Is the Directional Movement Index?
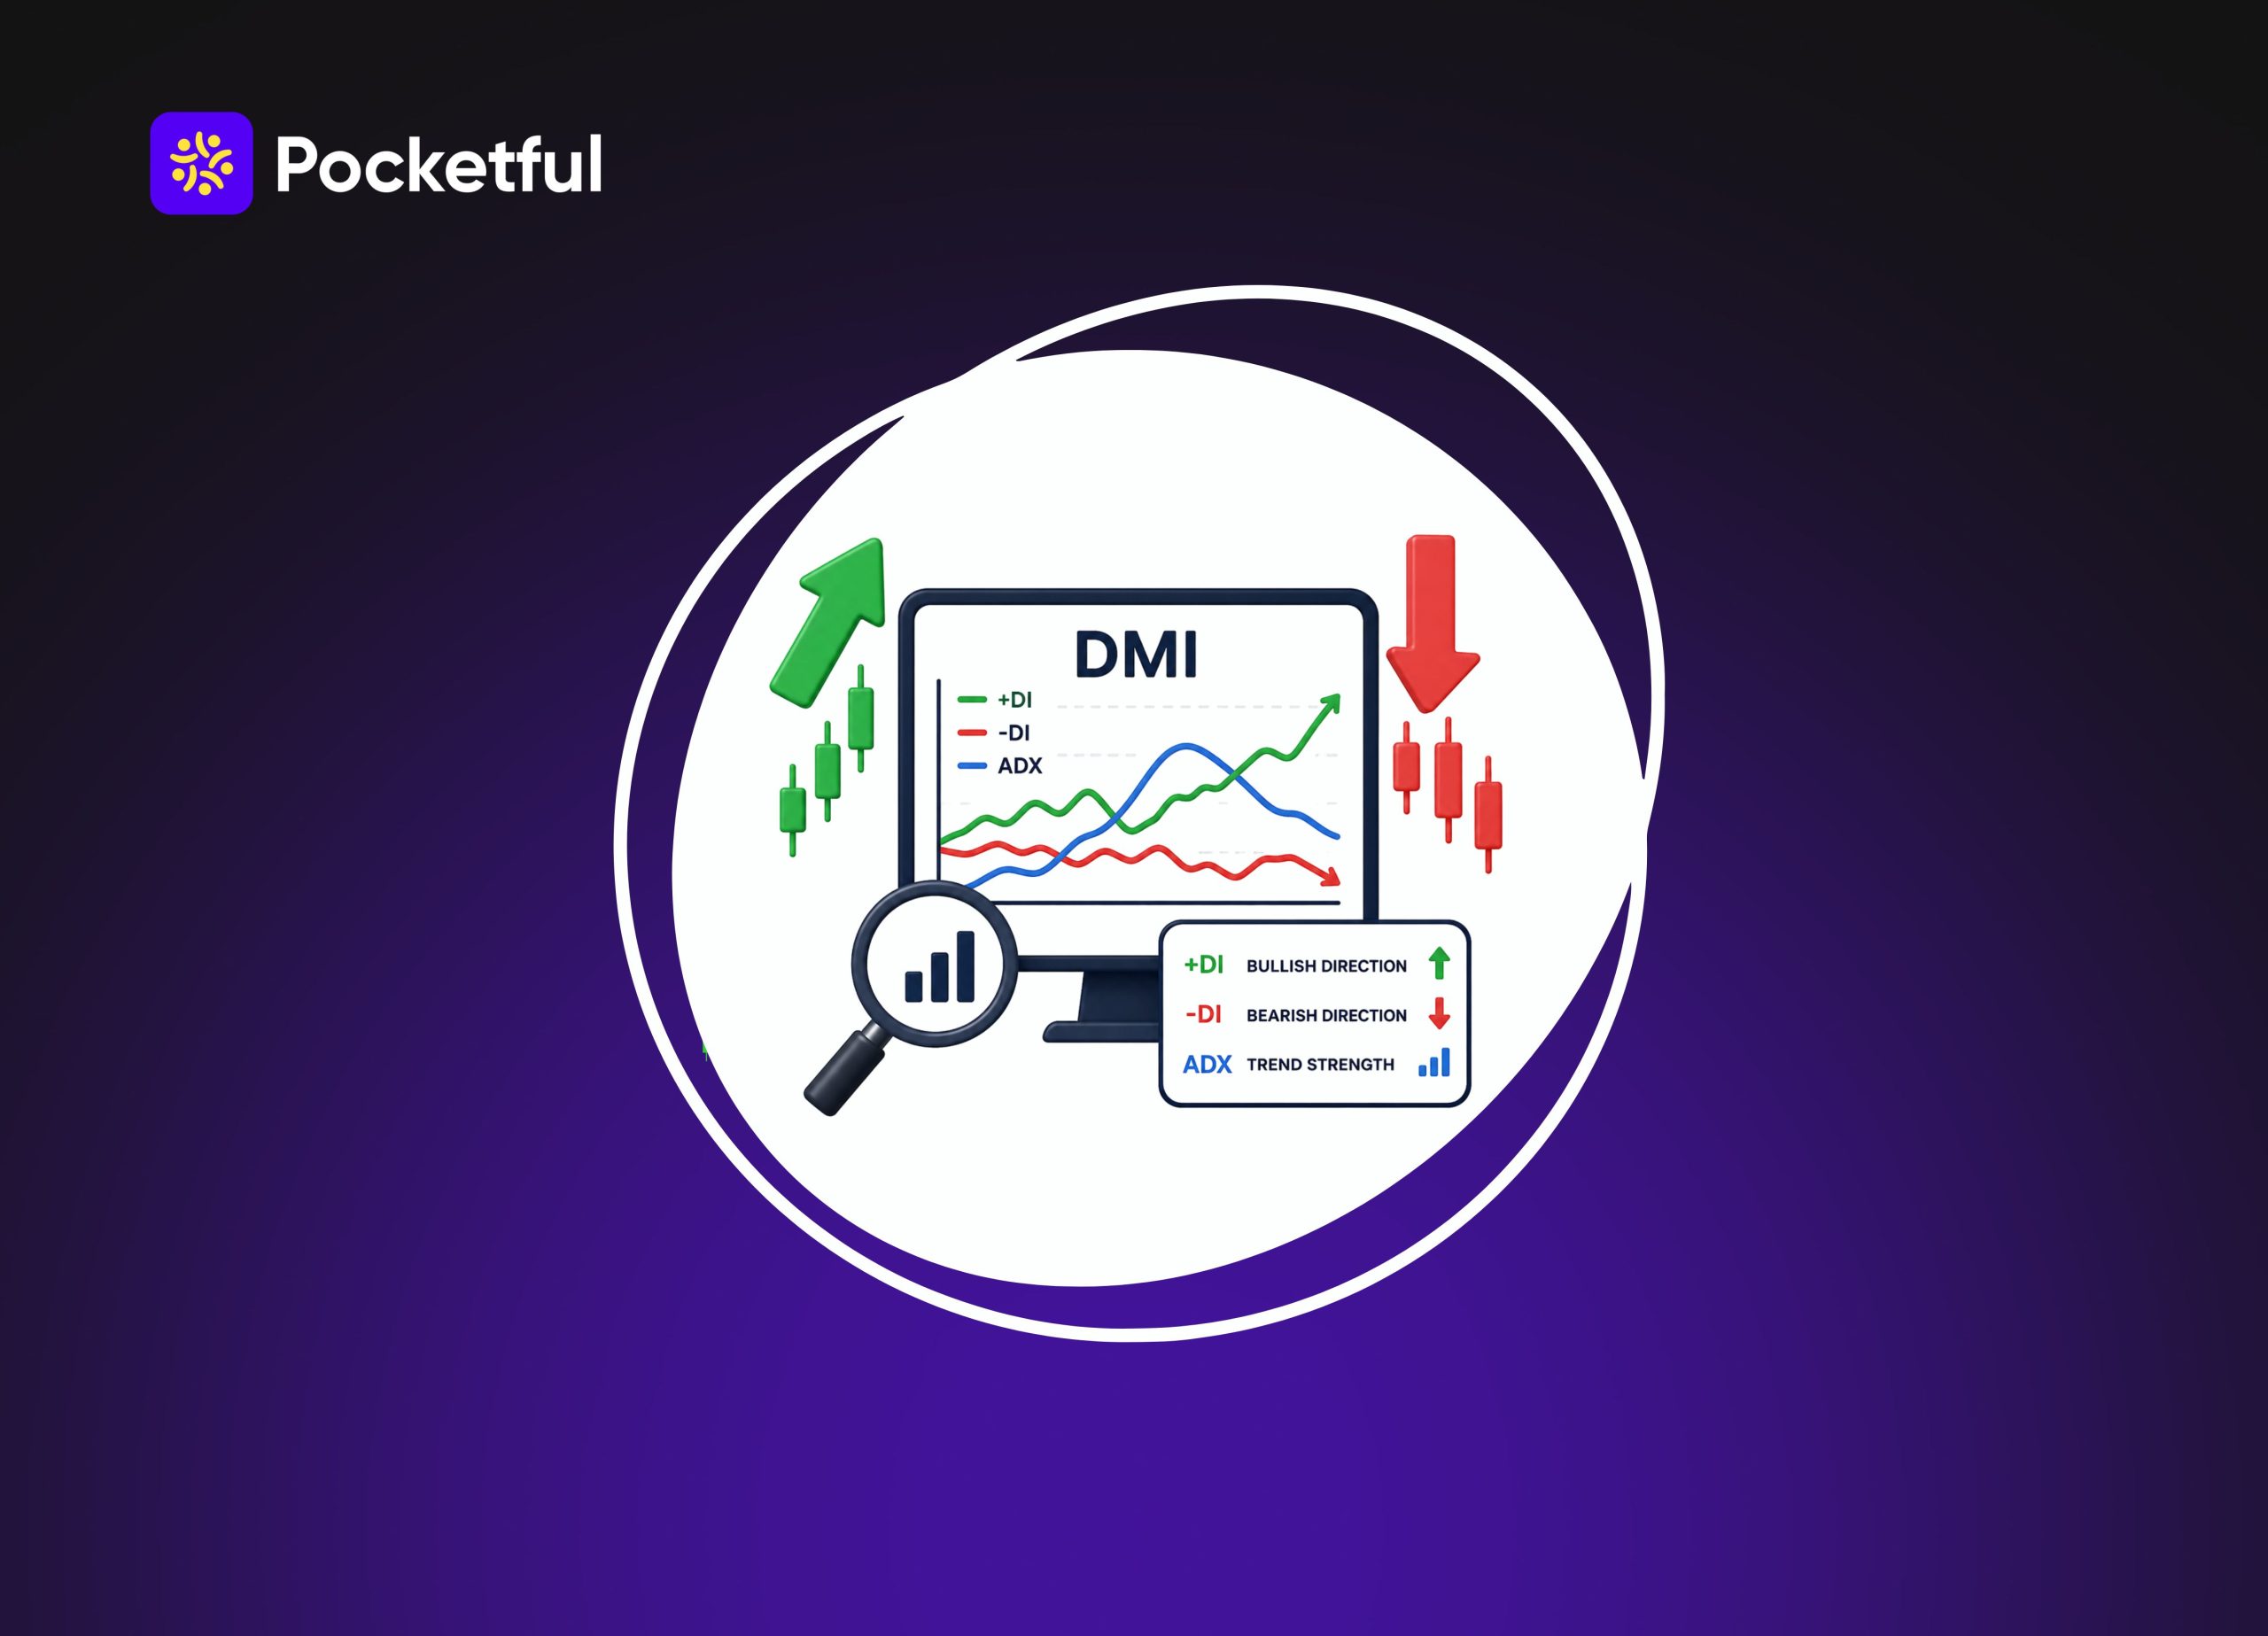
The Directional Movement Index (DMI) is a technical analysis indicator used to understand the direction and strength of a trend in a stock or index. It was developed by Welles Wilder. The DMI system consists of three main components: +DI, -DI, and ADX. Typically, the default look-back period is set to 14, although this can be adjusted based on the trading timeframe.
Three main components of DMI
| Component | What does it indicate? |
|---|---|
| +DI | Strength of upward price movement |
| -DI | Strength of downward price movement |
| ADX | How strong is the trend? |
How Does the DMI Indicator Work?
By comparing price movements, the DMI helps determine whether buying or selling pressure is stronger in the market. Its functioning can be understood through a few key steps.
Step 1: Comparing Price Movement
First, the high and low of the current candle are compared with those of the previous candle. This reveals which movement upward or downward is more significant.
Step 2: Determining +DM and -DM
If the upward movement is stronger, it is classified as Positive Directional Movement (+DM). Conversely, if the downward movement is stronger, it is classified as Negative Directional Movement (-DM).
Step 3: Incorporating True Range
Next, the True Range (TR) is used to measure the actual price movement. The +DM, -DM, and TR values are processed using Wilder’s smoothing method.
Step 4: Deriving +DI and -DI
The +DI and -DI values are calculated from the smoothed figures. By observing the positions of these two lines on the chart, a trader can gauge whether the upward or downward directional movement is stronger.
Step 5: ADX Indicates Trend Strength
Finally, the gap between +DI and -DI gives us the DX, which gets smoothed out to form the ADX. This indicator measures pure trend strength, though it won’t tell you which direction price is actually moving.
How to Read +DI, -DI and ADX?
To interpret the DMI correctly, simply observing the crossover of the lines is not enough. It is essential to analyze all three components together to understand the market’s direction and the strength of the move.
What does it mean when +DI is above -DI?
When +DI remains above -DI, the upward directional movement is considered relatively strong. If the stock price is simultaneously forming higher highs and higher lows, this can support the existence of a bullish trend. However, entering a trade solely based on a DI crossover is not the right approach.
What does it indicate when -DI is above +DI?
If -DI rises above +DI, it indicates that the downward directional movement is strengthening. For instance, if an NSE stock is consistently forming lower highs and lower lows while -DI is above +DI, this can provide additional confirmation of a bearish trend.
How do you read the ADX?
ADX simply shows trend strength, not which way prices are moving. As a quick rule, a reading past 25 usually means a solid trend is underway, whereas anything below 20 tells you the market is weak or just drifting sideways. That 20 to 25 zone stays pretty ambiguous. Don’t treat these as hard trading rules; they’re basic reference points.
Read Also: What is Price Action Trading & Price Action Strategy?
How to Use DMI in Trading: A Practical Process
The DMI is best utilized when viewed as part of a complete trading setup. Its purpose is not to take a trade on every signal, but rather to filter for superior setups.
- Assess the Setup on the Chart: First, check whether a setup such as a breakout, pullback, or trend continuation is forming in the stock.
- Mark Key Levels: Identify recent highs, lows, support, and resistance levels. These levels will assist in planning your entry and exit.
- Seek Confirmation from the DMI: Next, check if the DMI reading aligns with your setup. If both the price and the indicator point in the same direction, the setup becomes more compelling.
- Determine Risk Before Entry: Decide on your stop-loss and position size before executing the trade. This makes it easier to keep losses under control in the event of a false signal.
How to Use DMI for Intraday Trading in India?
In intraday trading, it is essential to interpret the DMI alongside short-term price movements. A practical approach involves observing the trend on a 15-minute chart and then determining the entry timing on a shorter timeframe.
- Start with the 15-Minute Chart: First, examine the overall DMI reading on the 15-minute chart. This provides better context regarding the direction of the trading session compared to shorter timeframes.
- Determine Entry Timing on the 5-Minute Chart: Once the broader setup is clear, you can look for entry opportunities on the 5-minute chart. Here, changes in the DMI lines should be considered significant only if the price is also moving in the same direction.
- Manage the Position During a Strong Move: If the trade moves in your favor, monitor price behavior rather than relying solely on a fixed target. If the DMI strength begins to wane, it may be time to review the position.
- An Important Precaution for Intraday Trading: The DMI is a lagging indicator; consequently, signals often appear after the price movement has already begun. This means that using it to catch the exact top or bottom is not the right approach.
DMI for Swing Trading: What Changes?
In swing trading, the DMI is used not for capturing minor intraday price fluctuations, but for identifying trends that persist over several days. Consequently, both the chart timeframe and the trade’s holding period are crucial factors.
- Observe the Trend on the Daily Chart: Swing traders typically begin by analyzing the daily chart. This approach filters out short-term market noise, making it easier to understand the stock’s broader price movement.
- Pay Attention to Pullbacks: Consider a scenario where a stock is in an uptrend and approaches a support level following a decline over a few sessions. By examining the DMI readings, a trader can assess whether this is merely a temporary pullback or if the trend is genuinely weakening.
- Review Based on the Holding Period: Since a swing trade position may be held for several days, it is not necessary to alter your decision based on every minor fluctuation in the DMI. It is more practical to re-evaluate the trade only when there is a significant shift in the price structure or the overall trend.
DMI With Other Technical Tools: What Actually Adds Value?
The DMI alone does not constitute a complete trading setup. However, choosing the right combination makes it easier to interpret price, trend, and market activity simultaneously.
1. DMI + Price Action
Price action provides the “ground reality” for the DMI. If the indicator signals a specific direction, check the chart to see if the candlesticks support that move. This helps avoid making decisions based solely on the indicator.
2. DMI + Moving Average
Moving Averages help identify the broader trend direction of a stock, while the DMI helps assess the strength of that trend. The two can be used together, particularly to filter and refine trend-following setups.
3. DMI + Volume
If volume rises alongside a price movement, that move warrants closer attention. Observing volume in conjunction with the DMI especially during breakouts in Indian stocks can provide useful confirmation.
Common Mistakes While Using DMI
The biggest mistake in understanding the DMI is interpreting the indicator without considering the market context. By avoiding certain common errors, its signals can be utilized more practically.
- Treating Every Crossover as a Trade: Taking a position immediately upon seeing a +DI and -DI crossover is not the right approach. In a sideways market, such signals can occur frequently, often lacking strong follow-through.
- Mistaking ADX for Direction: The ADX indicates only the strength of a trend. A rising ADX is not inherently a bullish signal; it can rise even during a strong downtrend.
- Treating Fixed Levels as Absolute Rules: ADX levels like 20 or 25 serve as useful reference points, but it is unwise to treat them as fixed entry rules across every stock and timeframe. The context of a signal can shift depending on market conditions.
- Relying Solely on the Indicator: The DMI is just one component of technical analysis. It is more sensible to make decisions by considering it alongside price behavior and other relevant market information.
Read Also: Best Indicators for Swing Trading
Conclusion
The DMI cannot give you a precise prediction of every market move, but it can certainly help you understand the trend. For Indian stocks, it is more practical to use it in conjunction with price action and risk management. Ultimately, having a clear setup and a defined risk strategy before entering a trade is more important than any single indicator.
Frequently Asked Questions (FAQs)
01
What is DMI in trading?
DMI is a technical indicator that helps in understanding the direction and strength of a trend.
02
What are +DI and -DI?
+DI represents upward movement, while -DI represents downward movement.
03
What is the role of ADX in DMI?
ADX indicates the strength of the prevailing market trend.
04
How is DMI used in trading?
DMI is used to assess trends and filter potential trading setups.
05
Can DMI be used for intraday trading?
Yes, DMI can also be used for intraday trading.
Disclaimer

The information shared in this content is intended solely for educational and informational purposes and should not be considered financial, investment, or trading advice. Any references to stocks, mutual funds, or market instruments are purely for informational purposes and do not constitute recommendations. Investments in financial markets are subject to market risks, and past performance is not indicative of future returns. Readers are advised to conduct independent research, review official documents carefully, and consult a qualified financial advisor before making any investment or trading decisions.
Article History