



| Type | Description | Contributor | Date |
|---|---|---|---|
 | Post created | Pocketful Team | Aug-17-26 |
Read Next
- Delta in Options: Meaning, Formula, Uses & Examples
- What is Commodity Pool Operator (CPO)?
- Best Penny Stock Trading Platforms, Brokers & Apps
- Bid Price and Ask Price: Key Differences
- What is After Hours Trading: Definition, Benefits & Risks
- Minimum Capital Required for Options Trading in India
- Trading Terminal: Meaning, Features, Types & Benefits
- MTF Charges vs Normal Trading Charges: Key Differences
- Slippage in Trading: Meaning, Types, Causes & How to Reduce It
- Types of Stock Market Orders Explained
- What Is Cash Trading? Meaning, How It Works & Benefits
- What is Max Pain Theory?
- What is Averaging Up in Stock Trading?
- What Is an After Market Order (AMO)? Meaning, Timing & How It Works
- How to Reduce Risk in Options Trading: 10 Tips
- What is Speculative Trading in Stock Market?
- What is Pair Trading?
- What is Quoted Price in Commodity Trading?
- How To Use Directional Movement Index In Trading?
- Kelly Criterion for Stock Trading
Best Strategies to Trade from Charts
Published on : 17th August 2026
|Updated on : 17th August 2026



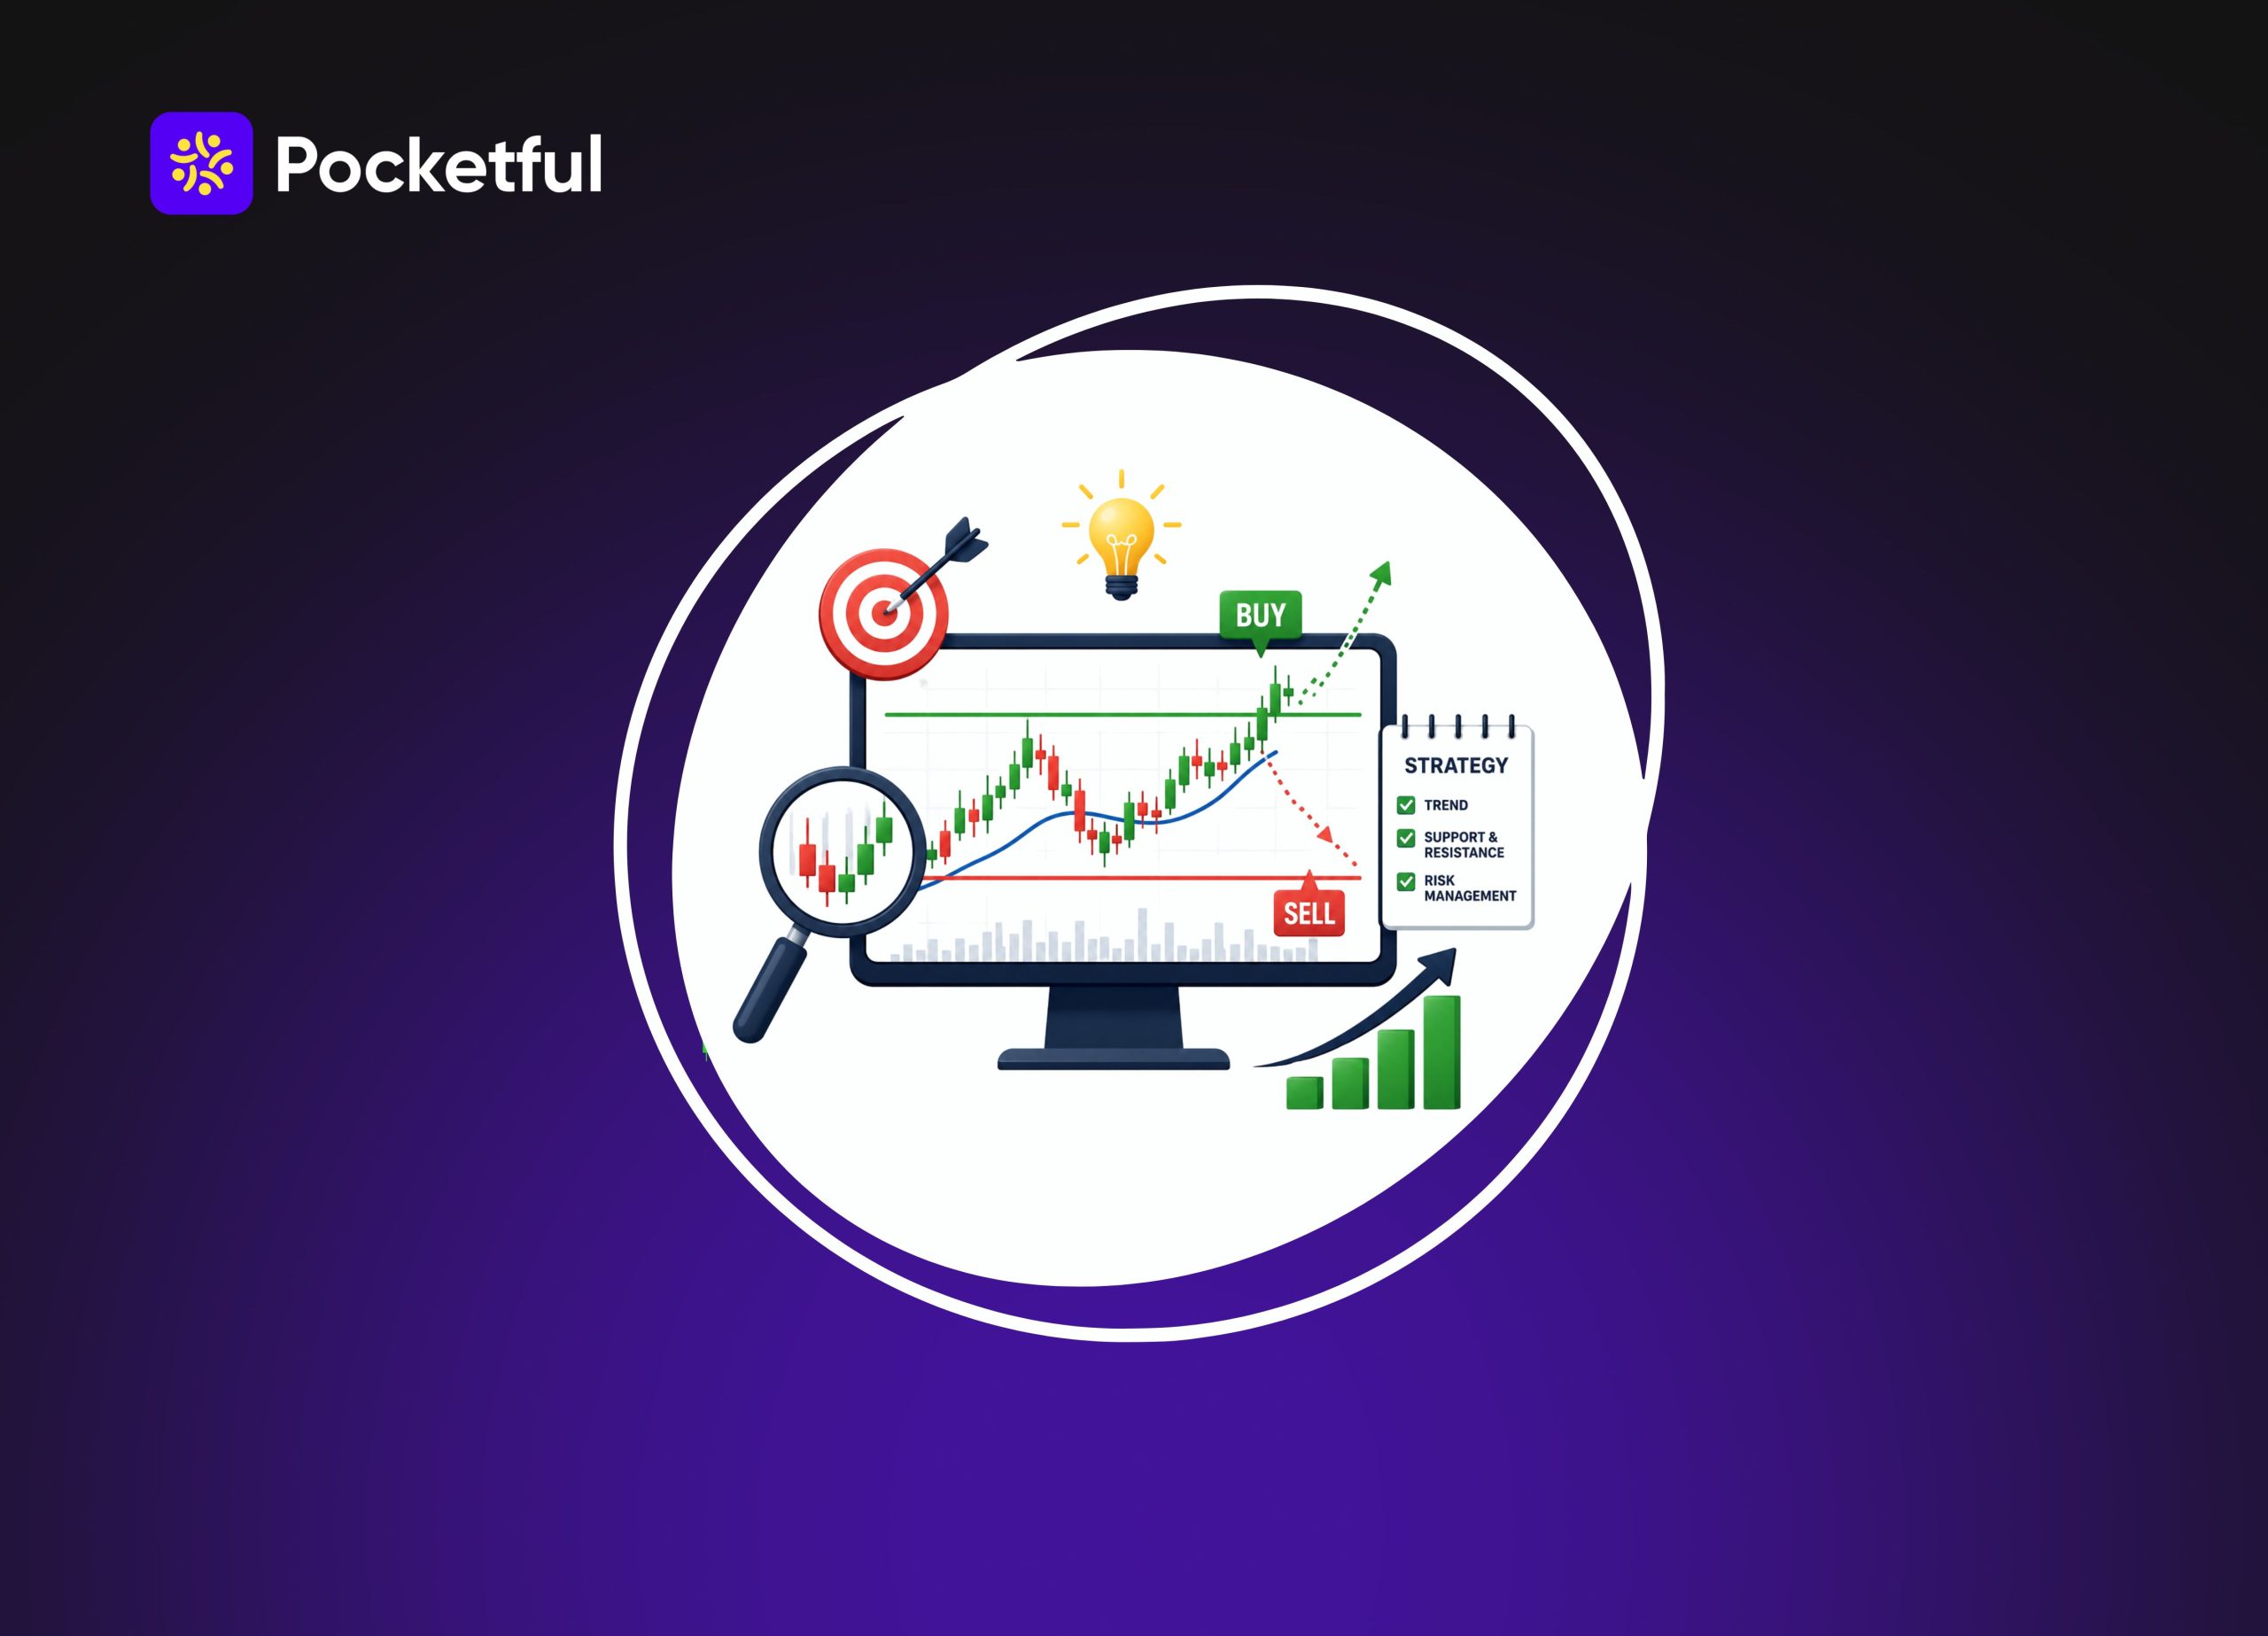
Using the best strategies to trade from charts can help traders to understand the market, identify potential entry and exit points, and manage risk more effectively. Using the right set of strategies can help to make the right call and avoid losses. But the question is, which of these strategies should you consider?
Well, read this guide to know all the details and understand the top chart-based strategies that can help you analyse opportunities more systematically.
What is Chart-Based Trading?
Chart-based trading is the practice of analysing price charts to make trading decisions instead of relying only on news or market opinions. This is where the traders analyse and understand the:
- Historical price movements
- Trading volume
- Technical indicators
All these together help to identify trends and potential trading setups.
The selection of the charts will be based on your personal trading style. The timeline will also be based on how long you wish to track the market or stay invested. Proper selection of duration will support better strategies for shorter and longer durations.
Chart trading works best when combined with proper risk management and a disciplined trading plan.
Best Strategies to Trade from Charts
The table below summarises some of the most widely used chart trading strategies.
| Strategy | Best For | Market Type | Difficulty |
|---|---|---|---|
| Trend Following | Swing & Intraday | Trending | Easy |
| Breakout Trading | Intraday | High momentum | Medium |
| Support & Resistance | All traders | Any market | Easy |
| Pullback Trading | Trend traders | Trending | Medium |
| Moving Average Strategy | Beginners | Trending | Easy |
| Reversal Trading | Experienced traders | Exhausted trends | Hard |
| Volume Confirmation | All traders | Any market | Easy |
| Multi-Timeframe Analysis | Swing trading | Any market | Medium |
| Range Trading | Sideways markets | Low volatility | Medium |
| Gap Trading | Intraday | Volatile markets | Medium |
1. Trend Following Strategy
Trend following is the simplest one, where traders follow the direction of the existing trend. There is no prediction or even analysis of reversals involved in this strategy.
An uptrend usually forms higher highs and higher lows. But at the same time, a downtrend forms lower highs and lower lows. Many traders use moving averages such as the 20 EMA or 50 EMA to confirm the trend.
The trader here focuses on a pullback before entering the market, which gives a better room for risk-return analysis. This also ensures that you stay aligned with the broader market in the longer run.
2. Breakout Trading Strategy
Breakout trading focuses on stocks or indices that move above resistance or below support with strong momentum. So when a breakout happens, you will see high trading volumes and increased participation. You can consider this a check of what you expected.
False breakouts are common, and traders usually wait for a candle that is beyond the existing breakout to ensure that there is a clear sign.
This strategy is widely used in both stocks and options, especially during highly volatile sessions.
3. Support and Resistance Strategy
Support and resistance are among the most important concepts in technical analysis.
Support is an area where buying interest tends to emerge, while resistance is where selling pressure may increase.
Traders look for bullish price action near support and bearish signals near resistance. You get a confirmation on the same; you can check and analyse the following:
- Candlestick patterns
- Trading volume
- Momentum indicators
Since these levels are watched by many traders, you can see some fluctuations in the short term, but that is nothing to worry about.
4. Pullback Trading Strategy
Pullback trading involves entering after a temporary correction within an existing trend. The traders usually avoid extreme buying and selling prices here.
For example, if a stock is in a strong uptrend, traders may wait for a pullback towards the 20 EMA or a previous support level before buying.
This approach often offers better entry prices and smaller stop-losses compared to following trends that might need high capital at times.
In this strategy, having patience is of utmost importance. Entering at the right time is crucial to success, and so you would need to stay put.
5. Moving Average Strategy
Moving averages help traders identify the overall market direction while taking the short-term movements into consideration for a broader and more effective analysis.
Common combinations include:
- 20 EMA for short-term trends
- 50 EMA for medium-term direction
- 200 EMA for long-term trend
Some traders also use moving average crossovers. For example, a shorter moving average crossing above a longer moving average may indicate strengthening momentum.
This is an indicator that is used in combination with others and is key when you are trying to understand the trends in the market.
6. Reversal Trading Strategy
Reversal trading aims to identify when an existing trend is losing strength and a new trend may begin.
Traders often look for signals such as:
- RSI divergence
- Reversal candlestick patterns
- Failed breakouts
- Strong support or resistance zones
Since reversals are difficult to predict, confirmation is essential before entering a trade.
Many traders combine reversal signals with volume analysis to reduce the chances of acting on a false signal.
7. Volume Confirmation Strategy
Volume confirmation strategy helps to see if the buyers and sellers are actually working in sync with the prices or not. Price movement without strong volume is often considered less reliable.
For example, if a stock breaks above resistance with significantly higher volume, the breakout is generally viewed as stronger than one occurring on low volume.
Volume can also confirm trend continuation, reversals, and support or resistance levels.
8. Multi-Timeframe Analysis Strategy
The multi-timeframe analysis strategy focuses on analysing and understanding the trades that happened at different times or ranges rather than just focusing on a single stance.
For example:
- Daily chart to identify the main trend
- One-hour chart to locate trading opportunities
- Fifteen-minute chart for precise entry
This approach helps traders avoid taking trades against the larger trend while improving entry timing.
9. Range Trading Strategy
Markets do not trend all the time. Many stocks spend long periods moving between support and resistance.
Range trading involves buying near support and selling near resistance while the price remains within the range.
Traders should avoid assuming the range will continue forever. Once the price breaks out with strong volume, the existing range may no longer remain valid.
Range trading is generally more suitable during low-volatility market conditions.
10. Gap Trading Strategy
Gap trading focuses on stocks or indices that open significantly above or below the previous day’s closing price.
These gaps often occur due to multiple situations, such as:
- Earnings announcements
- Economic events
- Important company news
Some traders look for gap continuation, while others trade gap-filling opportunities when the price moves back towards the previous close.
Before entering a gap trade, it is important to confirm direction using volume and price action rather than trading the gap blindly.
Read Also: Chart Patterns All Traders Should Know
Which Chart Trading Strategy Works Best?
Different strategies work better under different market conditions.
| Trading Goal | Suitable Strategy |
| Intraday trading | Breakout + Volume |
| Swing trading | Trend Following |
| Beginners | Support & Resistance |
| Trending markets | Pullback + EMA |
| Sideways markets | Range Trading |
| High-volatility sessions | Gap Trading |
| Trend reversals | RSI + Reversal Strategy |
| Better entries | Multi-Timeframe Analysis |
Rather than searching for a single “best” strategy, you should focus on creating a combination that matches your goals and aligns you with the market better.
How to Choose the Right Chart Trading Strategy
The right strategy depends on several factors, including:
- Your trading experience
- Time available for market analysis
- Risk tolerance
- Preferred trading style
- Current market volatility
- Whether the market is trending or range-bound
Beginners often benefit from simple strategies or even a single strategy, and it is usually moving average analysis or candlestick charts. Once you are good with these, you can move on to combinations and others.
How to Trade from Charts Using Pocketful
Pocketful provides interactive charts and technical analysis tools that can help traders identify opportunities more effectively.
A simple workflow may include:
- Select your preferred timeframe.
- Identify the overall market trend.
- Mark important support and resistance levels.
- Add indicators such as EMA or VWAP if required.
- Confirm price movement using volume.
- Plan your entry, target, and stop-loss.
- Select the stock or option contract.
- Place and monitor your trade through Pocketful.
When you follow a process that is defined, you can remove emotions from trading and can benefit more.
Read Also: Triple Top Reversal Chart Pattern
Common Mistakes While Trading from Charts
There are some of the mistakes that can cost you when you are analysing the charts. Keep your strategies simple to get the best outcome and ensure the below-mentioned mistakes are avoided.
- Trading every breakout without confirmation
- Ignoring trading volume
- Using too many indicators on one chart
- Ignoring the higher timeframe trend
- Entering without a stop-loss
- Chasing sharp price movements
- Taking trades based on emotions instead of analysis
Conclusion
The best strategies to trade from charts are based on your understanding of the market and the type of trades you wish to do. The focus should be on creating a proper balance, which involves time, price, and volume, all to ensure that you get the insights as needed.
This is where platforms like Pocketful can help you a great deal. You can get all the insights, tools, news, and support you need to make better trades and grow over time.
| S.NO. | Check Out These Interesting Posts You Might Enjoy! |
|---|---|
| 1 | High-Wave Candlestick Chart Pattern |
| 2 | Ascending Triangle Chart Pattern |
| 3 | Best Options Trading Chart Patterns |
| 4 | Best Swing Trading Patterns |
| 5 | What is the Flag and Pole Pattern? |
Frequently Asked Questions (FAQs)
01
Which is the best chart trading strategy for beginners?
Trend following and support and resistance strategies are generally considered the easiest for beginners because they focus on basic market structure and simple entry rules.
02
Which timeframe is best for chart trading?
The ideal timeframe depends on your trading style. Intraday traders often use 5-minute or 15-minute charts. But if you are trying to swing trade, then daily or 4-hour charts are better.
03
Is chart trading profitable?
Chart trading can be profitable when supported by proper analysis, risk management, and consistent execution. No strategy guarantees profits in every trade.
04
Can I trade using charts without technical indicators?
Yes. Many traders rely primarily on price action, support, resistance, and even volume, and they do not use technical indicators. But this is mainly good when you have experience and insights.
05
Which chart is most commonly used for trading?
Candlestick charts are the most widely used by traders. These charts show a clear sign of opening, closing, or even breakout, which makes them good for beginners too.
Disclaimer

The information shared in this content is intended solely for educational and informational purposes and should not be considered financial, investment, or trading advice. Any references to stocks, mutual funds, or market instruments are purely for informational purposes and do not constitute recommendations. Investments in financial markets are subject to market risks, and past performance is not indicative of future returns. Readers are advised to conduct independent research, review official documents carefully, and consult a qualified financial advisor before making any investment or trading decisions.
Article History