



| Type | Description | Contributor | Date |
|---|---|---|---|
 | Post created | Pocketful Team | Jul-30-26 |
Read Next
- Delta in Options: Meaning, Formula, Uses & Examples
- What is Commodity Pool Operator (CPO)?
- Best Penny Stock Trading Platforms, Brokers & Apps
- Bid Price and Ask Price: Key Differences
- What is After Hours Trading: Definition, Benefits & Risks
- Minimum Capital Required for Options Trading in India
- Trading Terminal: Meaning, Features, Types & Benefits
- MTF Charges vs Normal Trading Charges: Key Differences
- Slippage in Trading: Meaning, Types, Causes & How to Reduce It
- Types of Stock Market Orders Explained
- What Is Cash Trading? Meaning, How It Works & Benefits
- What is Max Pain Theory?
- What is Averaging Up in Stock Trading?
- What Is an After Market Order (AMO)? Meaning, Timing & How It Works
- How to Reduce Risk in Options Trading: 10 Tips
- What is Speculative Trading in Stock Market?
- What is Pair Trading?
- What is Quoted Price in Commodity Trading?
- Best Strategies to Trade from Charts
- How To Use Directional Movement Index In Trading?
What Is a Liquidity Sweep?
Published on : 30th July 2026
|Updated on : 30th July 2026



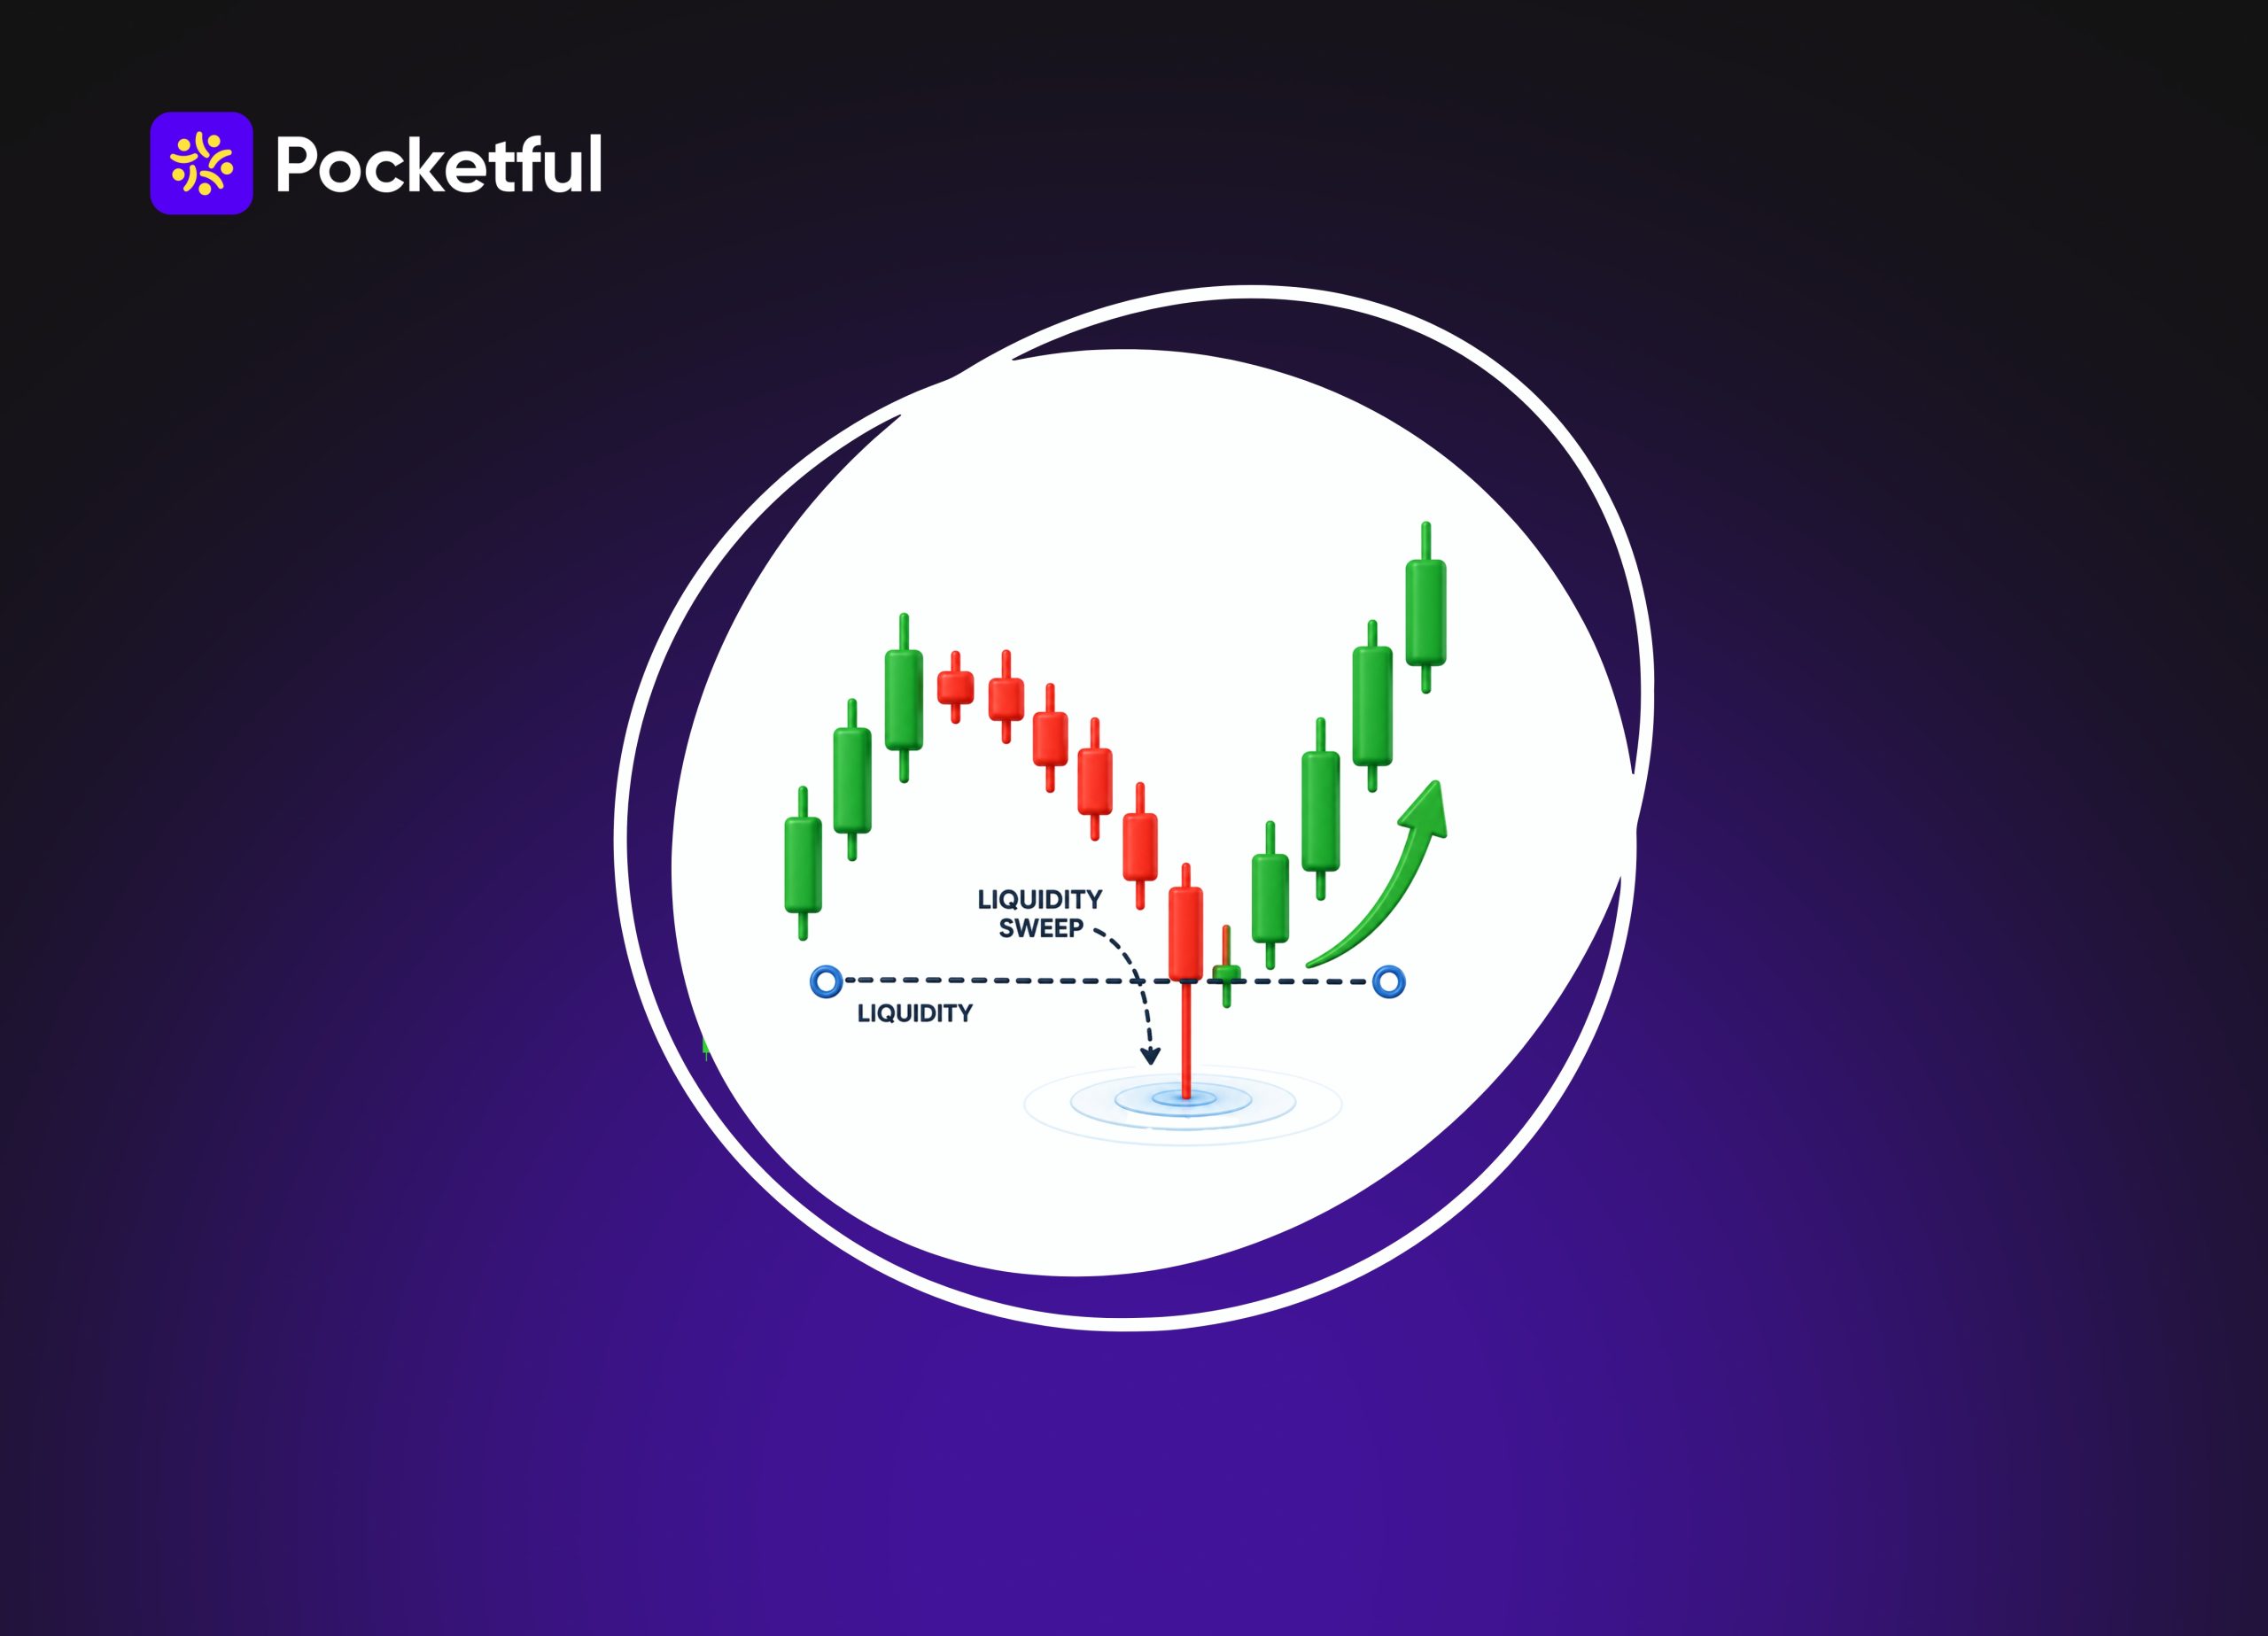
Traders often observe the price breaking through a significant support or resistance level, only to reverse direction shortly thereafter. To understand such a move, it is essential to know what a “liquidity sweep” is in trading. In this article, we will explain the meaning of a liquidity sweep in simple terms, look at an example, discuss why it occurs, learn how to identify it on a chart, and highlight the mistakes to avoid while trading. This will help you better understand market movements.
What Is a Liquidity Sweep in Trading?
A “Liquidity Sweep” is a price action concept in trading. It occurs when the price moves slightly above or below a significant level (such as a previous swing high, swing low, support, or resistance) to trigger the buy, sell, or stop-loss orders situated there. This process is known as a liquidity sweep. Following this, the price may continue moving in the same direction or reverse immediately.
Meaning of Liquidity Sweep
In simple terms, a liquidity sweep refers to the collection of liquidity (orders) present at a specific price level in the market. Here, “liquidity” refers to the buy, sell, and stop-loss orders that are clustered in large numbers around a particular level.
Example of a Liquidity Sweep
Suppose a stock’s previous high is ₹500. Many traders place buy orders above ₹500, while some short sellers place their stop-loss orders just above this same level. The price first rises to ₹503, triggering these orders. If the price subsequently drops back to ₹498, this serves as an example of a liquidity sweep; the price “swept” the liquidity located above the level before changing direction.
Why Does a Liquidity Sweep Happen?
The primary objective of a liquidity sweep is to reach price levels where the highest volume of orders is concentrated. This is why such sweeps frequently occur around key support, resistance, and swing levels.
- Access High-Liquidity Areas: The market often gravitates toward levels with a high concentration of buy, sell, and stop-loss orders. These zones are known as high-liquidity areas.
- Execute Large Orders: Large market participants require substantial liquidity to fill their sizable orders. Consequently, the price sometimes moves toward levels where a large volume of orders is available.
- Collect Clustered Stop-Loss Orders: Many traders place their stop-loss orders at similar price levels. When the price reaches these levels, multiple orders are triggered simultaneously, resulting in a surge in liquidity.
- Test Important Price Levels: The price often briefly breaches key support or resistance levels. This helps gauge the strength of buying or selling pressure at those specific levels.
- Facilitate Better Price Discovery: A liquidity sweep aids in matching available market orders and facilitates better price discovery for the subsequent market move. However, the direction of the market following such an event should always be confirmed through price action.
Where Does Liquidity Usually Build?
Liquidity is not distributed evenly across the chart. It tends to accumulate at price levels where a large number of traders place similar entry, exit, or stop-loss orders.
| Market Area | Why Liquidity Builds Here |
|---|---|
| Previous Swing High | Breakout buy orders and short traders’ stop-loss orders are often present above this level. |
| Previous Swing Low | Stop-loss and breakdown sell orders for long positions are frequently observed here. |
| Equal Highs | When the same high is formed multiple times, this level becomes a common focus for traders, leading to an increase in orders. |
| Equal Lows | A large number of stop-loss orders often accumulate below a low that is repeatedly tested. |
| Major Support & Resistance | These are levels where there is significant participation from both buyers and sellers; consequently, liquidity is also high. |
| Psychological Round Numbers | Traders often place orders at round levels such as ₹100, ₹500, ₹1,000, or ₹25,000, which increases liquidity at these points. |
Read Also: What is Pyramid Trading?
Types of Liquidity Sweeps
Liquidity sweeps are primarily of two types. Both occur at distinct price levels and aid in understanding market behavior.
1. Buy-Side Liquidity Sweep
A buy-side liquidity sweep occurs when the price moves above a previous swing high, equal high, or resistance level areas where buy orders and stop-loss orders from short sellers are located. If the price fails to sustain itself above this level after triggering these orders and subsequently drops back down, it is considered a buy-side liquidity sweep.
2. Sell-Side Liquidity Sweep
A sell-side liquidity sweep occurs when the price drops below a swing low, equal low, or support level. During this movement, stop-loss orders for long positions and sell orders are triggered. If the price subsequently rebounds, it may indicate a sell-side liquidity sweep.
3. Buy-Side vs Sell-Side Liquidity Sweep
| Buy-Side Liquidity Sweep | Sell-Side Liquidity Sweep |
|---|---|
| It forms above the Swing High or the resistance level. | It forms below the swing low or support level. |
| It collects buy-side liquidity. | It collects sell-side liquidity. |
| It often appears after an upward false breakout. | It often appears after a downward false break. |
| Upon receiving confirmation, the price may move downwards. | Upon receiving confirmation, the price may move upwards. |
Liquidity Sweep vs Liquidity Grab vs Stop Hunt
These three terms might seem similar, but in trading, they are used in slightly different contexts.
| Liquidity Sweep | Liquidity Grab | Stop Hunt |
|---|---|---|
| Price movement occurring at a significant liquidity zone. | A rapid price move that sweeps liquidity over a short timeframe. | A situation where traders’ stop-loss orders are triggered. |
| It is widely used in market structure analysis. | It is commonly used in price action trading. | It is the most widely used term in retail trading. |
| After this, the trend may continue or change. | Often, the move ends quickly. | This is often observed during a false breakout or false breakdown. |
How to Identify a Liquidity Sweep on a Chart
Observing a single candle is not enough to identify a liquidity sweep; it is essential to understand price action and key levels in conjunction.
- Mark Important Price Levels: First, mark recent swing highs, swing lows, support, and resistance levels on the chart. Liquidity sweeps often occur around these areas.
- Watch for a Temporary Price Break: Observe whether the price moves above or below a key level for a brief period. This can be an early indication that liquidity is being collected.
- Check the Candle Close: If the candle closes back inside the level instead of sustaining above or below it, the likelihood of a liquidity sweep increases.
- Look for Market Confirmation: Do not trade solely based on a level break. Confirm the price’s actual direction using subsequent candles and the market structure.
- Use Multiple Confirmations: For better decision-making, analyze the liquidity sweep alongside the trend, support and resistance levels, and other price action signals. This can help reduce the risk of entering a trade incorrectly.
How Traders Use Liquidity Sweeps in Their Trading Strategy
Many traders use the “Liquidity Sweep” concept to understand market context. It is not a standalone signal for entry or exit but rather a component of a broader trading plan.
- Finding High-Interest Trading Zones: Traders first identify price levels where market activity is likely to be high. This makes it easier to focus on significant trading zones.
- Timing Trade Entries: Some traders wait for a setup to form after a liquidity sweep; this allows them to enter the market at the right moment rather than rushing into a trade.
- Filtering Low-Quality Setups: Instead of trading every price break, traders can use liquidity sweeps to filter out weak setups, thereby reducing the number of unnecessary trades.
- Building Trading Confluence: Experienced traders combine liquidity sweep analysis with factors such as trends, support and resistance, volume, or other technical indicators. Having multiple confirmations makes decision-making easier.
- Managing Trading Risk: Insights gained from liquidity sweeps help traders determine whether the moment is right to enter a trade. This helps avoid taking positions without a clear setup.
Is Liquidity Sweep Trading Suitable for Beginners?
Beginners can also learn about Liquidity Sweeps, but a basic understanding of price action and market structure is essential first. Trading based solely on this concept without proper preparation is not the right approach.
- Learn the Basics First: Before diving into Liquidity Sweeps, it is best to learn fundamental concepts such as support and resistance, trends, and candlestick patterns.
- Practice Before Live Trading: Practice on historical charts or a demo account first. This allows you to understand Liquidity Sweep setups without exposing yourself to real financial risk.
- Use Charting Tools: Utilize advanced charting tools to better understand liquidity zones and price movements on the chart. For instance, advanced charts and other trading tools available on platforms like Pocketful can assist in market analysis.
- Focus on Confirmation: Beginners should not enter a trade simply because a level has been broken. It is advisable to make a decision only after receiving confirmation.
- Keep Risk Small: Start by practicing with a small amount of capital and limit the risk on each trade. This helps avoid significant losses while you are learning.
Conclusion
Understanding the “Liquidity Sweep” helps in better interpreting market behavior. It is not merely a standalone trading signal but a crucial component of price action and market structure. When combined with proper confirmation and risk management, it can assist in making better trading decisions. If you analyze charts, learning this concept will certainly prove beneficial.
Frequently Asked Questions (FAQs)
01
What is a liquidity sweep in trading?
It is a price move that triggers orders at a significant price level.
02
What does the liquidity sweep mean?
A liquidity sweep means gathering liquidity in the market.
03
Is a liquidity sweep a reversal signal?
No, a reversal doesn’t always have to happen.
04
How do you identify a liquidity sweep?
Look for significant highs, lows, and confirmations along with the price.
05
Is a liquidity sweep the same as a stop hunt?
No, the two are related, but not always the same.
Disclaimer

The information shared in this content is intended solely for educational and informational purposes and should not be considered financial, investment, or trading advice. Any references to stocks, mutual funds, or market instruments are purely for informational purposes and do not constitute recommendations. Investments in financial markets are subject to market risks, and past performance is not indicative of future returns. Readers are advised to conduct independent research, review official documents carefully, and consult a qualified financial advisor before making any investment or trading decisions.
Article History